Typhoon Dujuan - 2015/09/27 0000 UTC
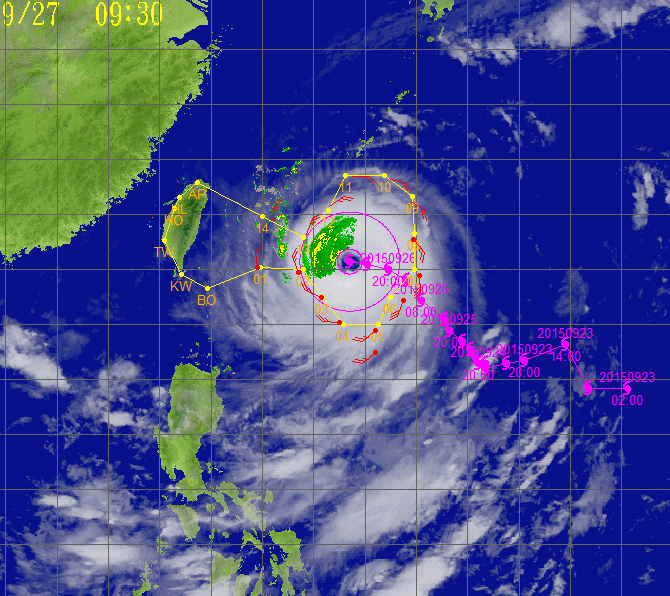
Flight route of DOTSTAR
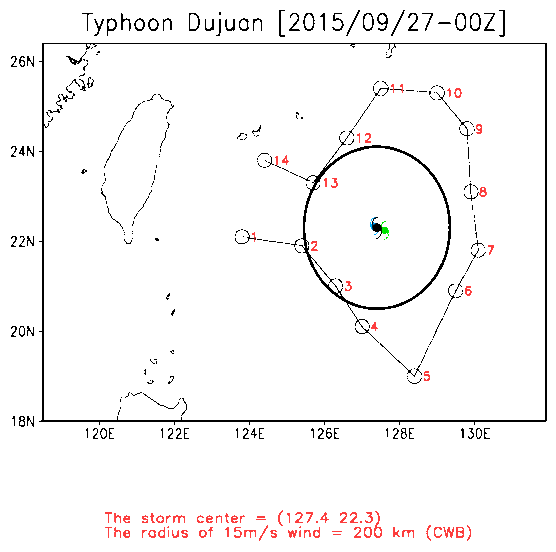
Storm symbol in black: Location of the storm center at 2015/09/27 0000 UTC.
Storm symbol in green: Location of the storm center as the first dropwindsonde reached the surface.
Storm symbol in blue: Location of the storm center as the last dropwindsonde reached the surface.
Wind vector at each pressure level
Dropwindsonde information and the estimated surface wind speed
| NO. | TIME | Longitude | Latitude | DIST | WD | WS | MBL | WL150 |
|---|---|---|---|---|---|---|---|---|
| 1 | 2015/09/26 22:13:23 | 123.8 | 22.1 | 392 | 350 | --- | 16.3 | 14.6 |
| 2 | 2015/09/26 22:26:39 | 125.4 | 21.9 | 231 | 322 | --- | 20.3 | 17.9 |
| 3 | 2015/09/26 22:37:36 | 126.3 | 21.0 | 195 | 287 | --- | 19.1 | 18.1 |
| 4 | 2015/09/26 22:46:43 | 127.0 | 20.1 | 246 | --- | --- | --- | --- |
| 5 | 2015/09/26 22:58:22 | 128.4 | 19.0 | 371 | --- | --- | --- | --- |
| 6 | 2015/09/26 23:09:59 | 129.5 | 20.9 | 257 | 186 | --- | 22.2 | 20.8 |
| 7 | 2015/09/26 23:20:27 | 130.1 | 21.8 | 276 | 159 | 22.4 | 21.6 | 19.5 |
| 8 | 2015/09/26 23:31:42 | 129.9 | 23.1 | 268 | 139 | 27.8 | 21.0 | 19.9 |
| 9 | 2015/09/26 23:42:25 | 129.8 | 24.5 | 347 | 124 | 16.4 | 16.2 | 15.1 |
| 10 | 2015/09/26 23:51:54 | 129.0 | 25.3 | 365 | 100 | 15.0 | 13.3 | 12.2 |
| 11 | 2015/09/27 00:03:26 | 127.5 | 25.4 | 346 | 080 | --- | 14.2 | 12.0 |
| 12 | 2015/09/27 00:15:59 | 126.6 | 24.3 | 229 | 035 | --- | 18.2 | 16.5 |
| 13 | 2015/09/27 00:26:32 | 125.7 | 23.3 | 200 | 357 | --- | 19.1 | 17.6 |
| 14 | 2015/09/27 00:36:58 | 124.4 | 23.8 | 341 | 353 | 20.7 | 17.3 | 17.0 |
TIME: Time when dropwindsondes reached the surface. (UTC)
DIST: The distance form each dropwindsonde to the corresponded storm center. (km)
WD: Surface wind direction. (degree)
Surface wind speed: (unit : m/s)
(1) WS: Surface wind speed (at a height of 10 meters) directly from the dropwindsondes.
(2) MBL (Franklin 2003): Averaging the dropwindsonde wind speed over the 0~500 m layer, multiplied by 0.80.
(3) WL150 (Franklin 2003): Averaging the dropwindsonde wind speed over the 0~150 m layer, divided by 1.229.
CWA QPESUMS Image
(925 hPa wind, one full barb = 10 m/s)
Ask for Data
If you want to ask for the raw data of dropwindsondes, please contact with Central Weather Administration (CWA).