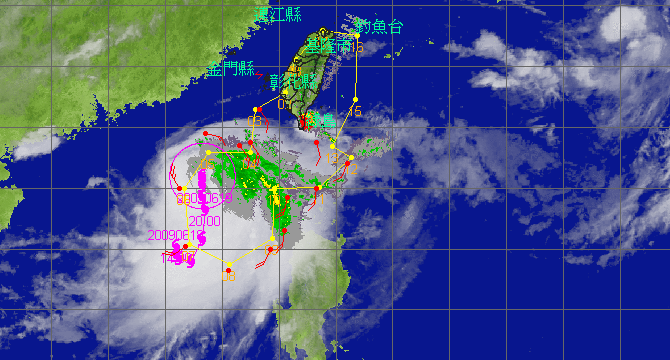
Typhoon Linfa - 2009/06/20 0000 UTC
Flight route of DOTSTAR
Storm symbol in black: Location of the storm center at 2009/06/20 0000 UTC.
Storm symbol in green: Location of the storm center as the first dropwindsonde reached the surface.
Storm symbol in blue: Location of the storm center as the last dropwindsonde reached the surface.
Wind vector at each pressure level
Dropwindsonde information and the estimated surface wind speed
| NO. | TIME | Longitude | Latitude | DIST | WD | WS | MBL | WL150 |
|---|---|---|---|---|---|---|---|---|
| 1 | 2009/06/19 21:46:28 | 119.3 | 22.6 | 327 | 135 | 11.1 | 9.1 | 8.9 |
| 2 | 2009/06/19 21:53:11 | 119.0 | 21.5 | 225 | 128 | --- | 12.7 | --- |
| 3 | 2009/06/19 22:03:44 | 118.6 | 21.4 | 185 | 105 | 13.0 | 11.4 | 11.0 |
| 4 | 2009/06/19 22:16:13 | 117.4 | 21.8 | 158 | 084 | 13.1 | 11.5 | 11.0 |
| 5 | 2009/06/19 22:34:14 | 116.5 | 20.0 | 89 | --- | --- | 20.0 | --- |
| 6 | 2009/06/19 22:55:02 | 116.7 | 18.1 | 256 | 240 | --- | 11.7 | 11.7 |
| 7 | 2009/06/19 23:06:10 | 118.2 | 17.3 | 353 | --- | --- | --- | --- |
| 8 | 2009/06/19 23:21:47 | 119.7 | 18.0 | 363 | 203 | 10.7 | 13.1 | 11.0 |
| 9 | 2009/06/19 23:30:48 | 120.2 | 18.6 | 360 | 176 | 11.7 | 11.0 | 9.9 |
| 10 | 2009/06/19 23:40:01 | 120.3 | 19.7 | 318 | 169 | 13.8 | 14.6 | 12.2 |
| 11 | 2009/06/19 23:48:56 | 121.3 | 20.0 | 417 | 165 | --- | 6.4 | 6.1 |
| 12 | 2009/06/20 00:00:05 | 122.4 | 20.8 | 531 | 177 | --- | 4.8 | 4.1 |
| 13 | 2009/06/20 00:14:51 | 121.3 | 21.5 | 431 | 173 | 10.7 | 8.3 | 8.4 |
TIME: Time when dropwindsondes reached the surface. (UTC)
DIST: The distance form each dropwindsonde to the corresponded storm center. (km)
WD: Surface wind direction. (degree)
Surface wind speed: (unit : m/s)
(1) WS: Surface wind speed (at a height of 10 meters) directly from the dropwindsondes.
(2) MBL (Franklin 2003): Averaging the dropwindsonde wind speed over the 0~500 m layer, multiplied by 0.80.
(3) WL150 (Franklin 2003): Averaging the dropwindsonde wind speed over the 0~150 m layer, divided by 1.229.
CWA QPESUMS Image
(925 hPa wind, one full barb = 10 m/s)
Ask for Data
If you want to ask for the raw data of dropwindsondes, please contact with Central Weather Administration (CWA).