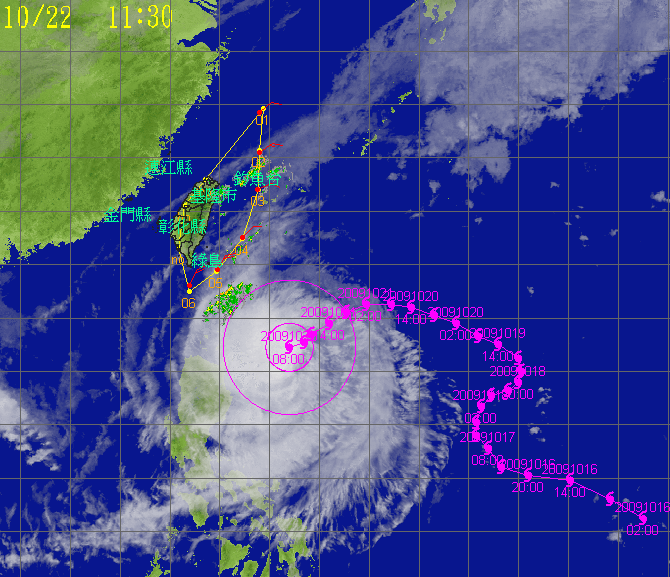
Typhoon Lupit - 2009/10/22 0000 UTC
Flight route of DOTSTAR
Storm symbol in black: Location of the storm center at 2009/10/22 0000 UTC.
Storm symbol in green: Location of the storm center as the first dropwindsonde reached the surface.
Storm symbol in blue: Location of the storm center as the last dropwindsonde reached the surface.
Wind vector at each pressure level
Dropwindsonde information and the estimated surface wind speed
| NO. | TIME | Longitude | Latitude | DIST | WD | WS | MBL | WL150 |
|---|---|---|---|---|---|---|---|---|
| 1 | 2009/10/21 23:25:56 | 123.6 | 27.7 | 986 | 057 | --- | 10.3 | 10.2 |
| 2 | 2009/10/21 23:41:40 | 123.6 | 26.2 | 821 | 039 | 13.5 | 11.7 | 12.2 |
| 3 | 2009/10/21 23:54:29 | 123.5 | 24.8 | 669 | 074 | 6.6 | 7.3 | 5.6 |
| 4 | 2009/10/22 00:13:03 | 122.9 | 23.0 | 496 | 030 | 13.6 | 10.9 | 10.8 |
| 5 | 2009/10/22 00:26:41 | 121.9 | 21.8 | 443 | 013 | --- | 17.2 | 17.4 |
| 6 | 2009/10/22 00:36:58 | 120.8 | 21.2 | 488 | 024 | --- | 13.1 | 13.5 |
TIME: Time when dropwindsondes reached the surface. (UTC)
DIST: The distance form each dropwindsonde to the corresponded storm center. (km)
WD: Surface wind direction. (degree)
Surface wind speed: (unit : m/s)
(1) WS: Surface wind speed (at a height of 10 meters) directly from the dropwindsondes.
(2) MBL (Franklin 2003): Averaging the dropwindsonde wind speed over the 0~500 m layer, multiplied by 0.80.
(3) WL150 (Franklin 2003): Averaging the dropwindsonde wind speed over the 0~150 m layer, divided by 1.229.
CWA QPESUMS Image
(925 hPa wind, one full barb = 10 m/s)
Ask for Data
If you want to ask for the raw data of dropwindsondes, please contact with Central Weather Administration (CWA).