Typhoon Meari - 2011/06/23 0000 UTC
Flight route of DOTSTAR
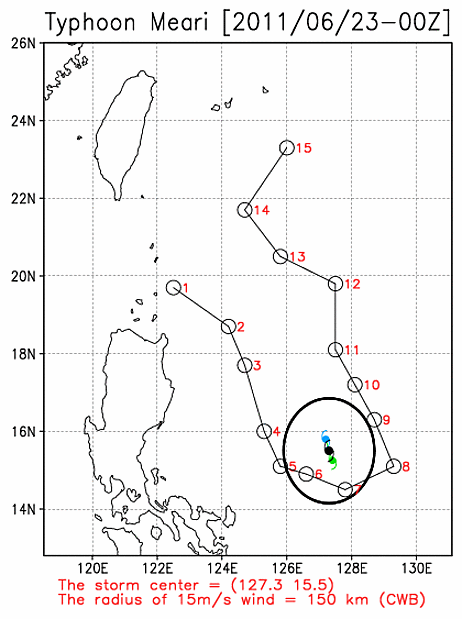
Storm symbol in black: Location of the storm center at 2011/06/23 0000 UTC.
Storm symbol in green: Location of the storm center as the first dropwindsonde reached the surface.
Storm symbol in blue: Location of the storm center as the last dropwindsonde reached the surface.
Wind vector at each pressure level
Dropwindsonde information and the estimated surface wind speed
| NO. | TIME | Longitude | Latitude | DIST | WD | WS | MBL | WL150 |
|---|---|---|---|---|---|---|---|---|
| 1 | 2011/06/22 22:20:37 | 122.5 | 19.7 | 714 | 046 | 10.0 | 8.5 | 8.5 |
| 2 | 2011/06/22 22:36:56 | 124.2 | 18.7 | 508 | 047 | 11.4 | 10.3 | 9.5 |
| 3 | 2011/06/22 22:52:14 | 124.7 | 17.7 | 388 | --- | --- | --- | --- |
| 4 | 2011/06/22 22:59:54 | 125.3 | 16.0 | 233 | --- | --- | --- | --- |
| 5 | 2011/06/22 23:13:39 | 125.8 | 15.1 | 169 | 286 | --- | 9.9 | --- |
| 6 | 2011/06/22 23:20:16 | 126.6 | 14.9 | 97 | --- | --- | --- | --- |
| 7 | 2011/06/22 23:30:59 | 127.8 | 14.5 | 115 | 251 | --- | 21.2 | 18.1 |
| 8 | 2011/06/22 23:46:46 | 129.3 | 15.1 | 217 | 227 | --- | 18.2 | 17.5 |
| 9 | 2011/06/22 23:58:54 | 128.7 | 16.3 | 174 | 192 | --- | 7.2 | 6.9 |
| 10 | 2011/06/23 00:10:08 | 128.1 | 17.2 | 205 | 040 | 12.7 | 10.3 | 9.9 |
| 11 | 2011/06/23 00:19:42 | 127.5 | 18.1 | 285 | 067 | --- | 17.0 | 14.6 |
| 12 | 2011/06/23 00:33:51 | 127.5 | 19.8 | 469 | 081 | 17.1 | 17.6 | 16.4 |
| 13 | 2011/06/23 00:52:02 | 125.8 | 20.5 | 562 | 056 | 13.2 | 12.8 | 11.9 |
| 14 | 2011/06/23 01:08:41 | 124.7 | 21.7 | 720 | 066 | 10.2 | 10.0 | 8.6 |
| 15 | 2011/06/23 01:29:27 | 126.0 | 23.3 | 851 | 090 | 11.1 | 9.1 | 8.9 |
TIME: Time when dropwindsondes reached the surface. (UTC)
DIST: The distance form each dropwindsonde to the corresponded storm center. (km)
WD: Surface wind direction. (degree)
Surface wind speed: (unit : m/s)
(1) WS: Surface wind speed (at a height of 10 meters) directly from the dropwindsondes.
(2) MBL (Franklin 2003): Averaging the dropwindsonde wind speed over the 0~500 m layer, multiplied by 0.80.
(3) WL150 (Franklin 2003): Averaging the dropwindsonde wind speed over the 0~150 m layer, divided by 1.229.
CWA QPESUMS Image
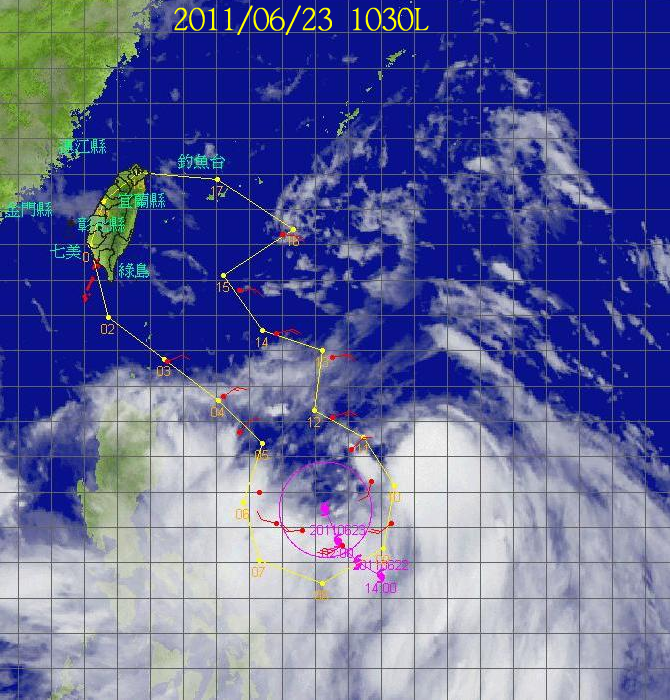
(925 hPa wind, one full barb = 10 m/s)
Ask for Data
If you want to ask for the raw data of dropwindsondes, please contact with Central Weather Administration (CWA).