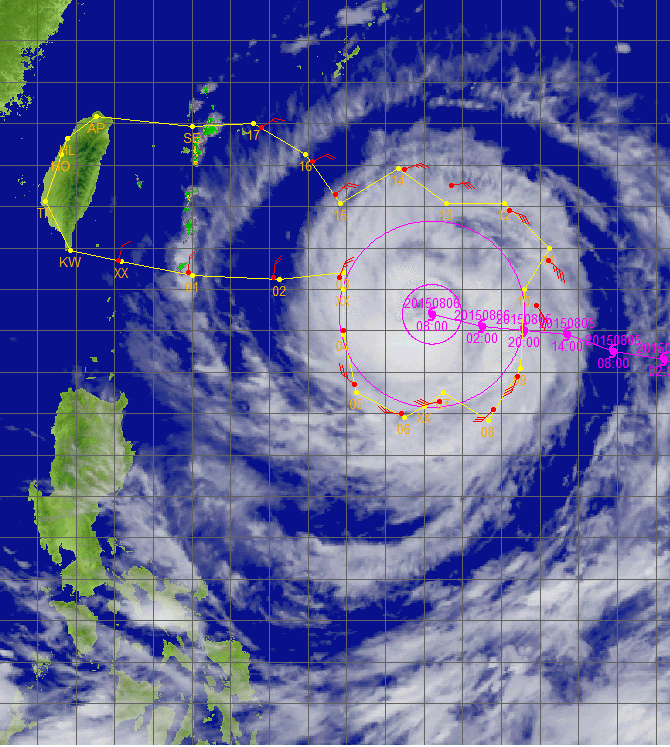
Typhoon Soudelor - 2015/08/06 0000 UTC
Flight route of DOTSTAR
Storm symbol in black: Location of the storm center at 2015/08/06 0000 UTC.
Storm symbol in green: Location of the storm center as the first dropwindsonde reached the surface.
Storm symbol in blue: Location of the storm center as the last dropwindsonde reached the surface.
Wind vector at each pressure level
Dropwindsonde information and the estimated surface wind speed
| NO. | TIME | Longitude | Latitude | DIST | WD | WS | MBL | WL150 |
|---|---|---|---|---|---|---|---|---|
| 1 | 2015/08/05 21:54:25 | 122.1 | 21.7 | 897 | 012 | --- | 8.2 | 8.6 |
| 2 | 2015/08/05 22:08:14 | 123.9 | 21.4 | 710 | 350 | 11.3 | 10.0 | 9.6 |
| 3 | 2015/08/05 22:28:15 | 126.1 | 21.3 | 472 | 008 | --- | 13.5 | 12.9 |
| 4 | 2015/08/05 22:43:50 | 127.8 | 21.3 | 294 | 011 | 19.5 | 17.5 | 16.8 |
| 5 | 2015/08/05 22:54:12 | 127.9 | 20.0 | 266 | 324 | --- | 17.1 | 15.9 |
| 6 | 2015/08/05 23:06:00 | 128.2 | 18.6 | 296 | --- | --- | 18.4 | --- |
| 7 | 2015/08/05 23:16:32 | 129.4 | 18.0 | 284 | 257 | 18.5 | 17.5 | 17.0 |
| 8 | 2015/08/05 23:25:41 | 130.4 | 18.3 | 228 | 229 | --- | 21.4 | 20.1 |
| 9 | 2015/08/05 23:39:19 | 131.8 | 18.1 | 303 | 208 | --- | 21.3 | 18.2 |
| 10 | 2015/08/05 23:46:47 | 132.4 | 18.9 | 283 | 179 | 20.0 | 20.1 | 18.0 |
| 11 | 2015/08/06 00:00:40 | 132.9 | 20.6 | 277 | 134 | 23.5 | 22.5 | 18.8 |
| 12 | 2015/08/06 00:10:18 | 133.2 | 21.7 | 343 | 119 | --- | 23.0 | 19.4 |
| 13 | 2015/08/06 00:22:42 | 132.2 | 22.9 | 354 | 103 | 20.3 | 21.1 | 19.3 |
| 14 | 2015/08/06 00:35:50 | 130.7 | 23.5 | 348 | 079 | --- | 20.6 | 18.2 |
| 15 | 2015/08/06 00:44:57 | 129.5 | 23.9 | 383 | 058 | --- | 18.0 | 15.3 |
| 16 | 2015/08/06 01:01:11 | 127.7 | 23.3 | 393 | 034 | --- | 16.9 | 16.4 |
| 17 | 2015/08/06 01:08:18 | 127.1 | 24.1 | 502 | 054 | 14.7 | 15.6 | 14.2 |
| 18 | 2015/08/06 01:20:23 | 125.8 | 24.9 | 653 | 055 | --- | 11.4 | 10.9 |
TIME: Time when dropwindsondes reached the surface. (UTC)
DIST: The distance form each dropwindsonde to the corresponded storm center. (km)
WD: Surface wind direction. (degree)
Surface wind speed: (unit : m/s)
(1) WS: Surface wind speed (at a height of 10 meters) directly from the dropwindsondes.
(2) MBL (Franklin 2003): Averaging the dropwindsonde wind speed over the 0~500 m layer, multiplied by 0.80.
(3) WL150 (Franklin 2003): Averaging the dropwindsonde wind speed over the 0~150 m layer, divided by 1.229.
CWA QPESUMS Image
(925 hPa wind, one full barb = 10 m/s)
Ask for Data
If you want to ask for the raw data of dropwindsondes, please contact with Central Weather Administration (CWA).