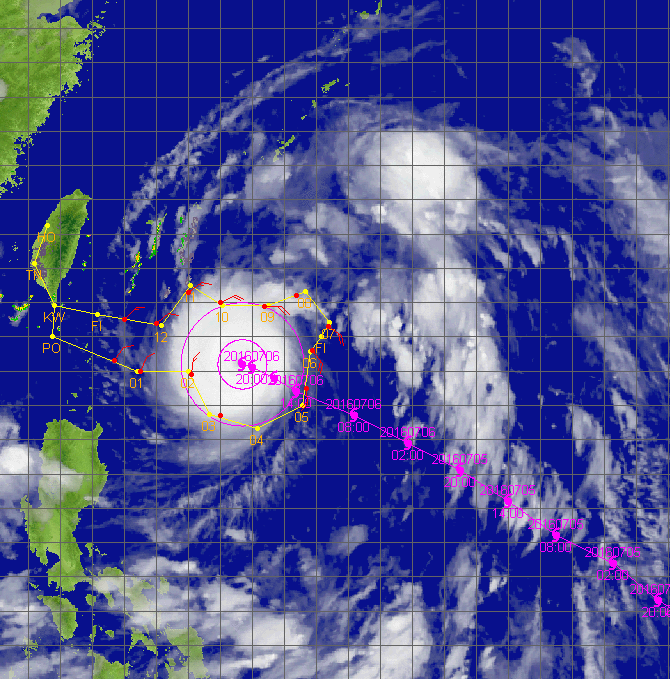
Typhoon Nepartak - 2016/07/06 1200 UTC
Flight route of DOTSTAR

Storm symbol in black: Location of the storm center at 2016/07/06 1200 UTC.
Storm symbol in green: Location of the storm center as the first dropwindsonde reached the surface.
Storm symbol in blue: Location of the storm center as the last dropwindsonde reached the surface.
Wind vector at each pressure level
Dropwindsonde information and the estimated surface wind speed
| NO. | TIME | Longitude | Latitude | DIST | WD | WS | MBL | WL150 |
|---|---|---|---|---|---|---|---|---|
| 1 | 2016/07/06 10:10:23 | 122.7 | 20.3 | 492 | 041 | --- | 6.9 | 6.9 |
| 2 | 2016/07/06 10:18:08 | 123.5 | 20.0 | 408 | 036 | --- | 8.9 | 8.9 |
| 3 | 2016/07/06 10:33:00 | 125.1 | 19.9 | 237 | 353 | --- | 8.7 | 8.6 |
| 4 | 2016/07/06 10:47:28 | 125.9 | 18.7 | 200 | 293 | 9.9 | 8.6 | 8.3 |
| 5 | 2016/07/06 11:16:45 | 128.7 | 19.5 | 168 | 146 | --- | 15.5 | 15.1 |
| 6 | 2016/07/06 11:26:32 | 128.9 | 20.6 | 194 | 127 | --- | 15.1 | 14.8 |
| 7 | 2016/07/06 11:34:06 | 129.4 | 21.3 | 276 | 112 | 14.7 | 13.5 | 12.6 |
| 8 | 2016/07/06 11:47:12 | 128.4 | 21.4 | 201 | 089 | 18.1 | 15.3 | 15.4 |
| 9 | 2016/07/06 11:55:29 | 127.4 | 21.5 | 162 | 068 | --- | 15.0 | 13.1 |
| 10 | 2016/07/06 12:05:34 | 126.0 | 22.0 | 229 | 058 | 17.7 | 15.3 | 15.2 |
| 11 | 2016/07/06 12:21:31 | 123.9 | 21.4 | 338 | --- | --- | --- | --- |
| 12 | 2016/07/06 12:14:54 | 125.0 | 22.3 | 321 | 036 | 12.5 | 12.2 | 11.8 |
| 13 | 2016/07/06 12:36:02 | 123.0 | 21.5 | 434 | --- | --- | --- | --- |
TIME: Time when dropwindsondes reached the surface. (UTC)
DIST: The distance form each dropwindsonde to the corresponded storm center. (km)
WD: Surface wind direction. (degree)
Surface wind speed: (unit : m/s)
(1) WS: Surface wind speed (at a height of 10 meters) directly from the dropwindsondes.
(2) MBL (Franklin 2003): Averaging the dropwindsonde wind speed over the 0~500 m layer, multiplied by 0.80.
(3) WL150 (Franklin 2003): Averaging the dropwindsonde wind speed over the 0~150 m layer, divided by 1.229.
CWA QPESUMS Image
(925 hPa wind, one full barb = 10 m/s)
Ask for Data
If you want to ask for the raw data of dropwindsondes, please contact with Central Weather Administration (CWA).