Typhoon Talim - 2012/06/19 1200 UTC
Flight route of DOTSTAR
Storm symbol in black: Location of the storm center at 2012/06/19 1200 UTC.
Storm symbol in green: Location of the storm center as the first dropwindsonde reached the surface.
Storm symbol in blue: Location of the storm center as the last dropwindsonde reached the surface.
Wind vector at each pressure level
Dropwindsonde information and the estimated surface wind speed
| NO. | TIME | Longitude | Latitude | DIST | WD | WS | MBL | WL150 |
|---|---|---|---|---|---|---|---|---|
| 1 | 2012/06/19 10:47:20 | 118.1 | 22.5 | 257 | 108 | --- | 6.1 | 5.8 |
| 2 | 2012/06/19 10:56:54 | 118.1 | 21.5 | 191 | 163 | --- | 11.0 | 10.5 |
| 3 | 2012/06/19 11:06:16 | 118.0 | 20.9 | 169 | 180 | --- | 15.8 | 14.7 |
| 4 | 2012/06/19 11:17:45 | 118.6 | 19.3 | 295 | 196 | 15.5 | 17.7 | 14.6 |
| 5 | 2012/06/19 11:29:44 | 119.0 | 20.2 | 288 | 194 | --- | 16.8 | 14.9 |
| 6 | 2012/06/19 11:41:07 | 120.4 | 20.1 | 421 | 186 | --- | 15.1 | 14.3 |
| 7 | 2012/06/19 11:50:12 | 120.8 | 21.0 | 444 | 190 | 14.2 | 13.8 | 12.2 |
| 8 | 2012/06/19 11:52:21 | 120.4 | 21.1 | 405 | --- | --- | --- | --- |
| 9 | 2012/06/19 12:04:48 | 120.1 | 22.1 | 391 | --- | --- | --- | --- |
| 10 | 2012/06/19 12:17:17 | 119.1 | 21.9 | 277 | 168 | --- | 10.4 | 10.1 |
| 11 | 2012/06/19 12:26:30 | 119.0 | 22.7 | 307 | 154 | --- | 8.4 | 7.6 |
TIME: Time when dropwindsondes reached the surface. (UTC)
DIST: The distance form each dropwindsonde to the corresponded storm center. (km)
WD: Surface wind direction. (degree)
Surface wind speed: (unit : m/s)
(1) WS: Surface wind speed (at a height of 10 meters) directly from the dropwindsondes.
(2) MBL (Franklin 2003): Averaging the dropwindsonde wind speed over the 0~500 m layer, multiplied by 0.80.
(3) WL150 (Franklin 2003): Averaging the dropwindsonde wind speed over the 0~150 m layer, divided by 1.229.
CWA QPESUMS Image
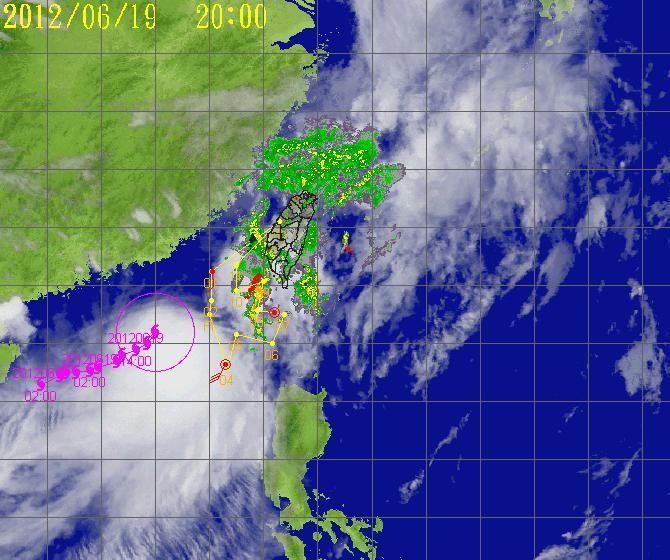
(925 hPa wind, one full barb = 10 m/s)
Ask for Data
If you want to ask for the raw data of dropwindsondes, please contact with Central Weather Administration (CWA).