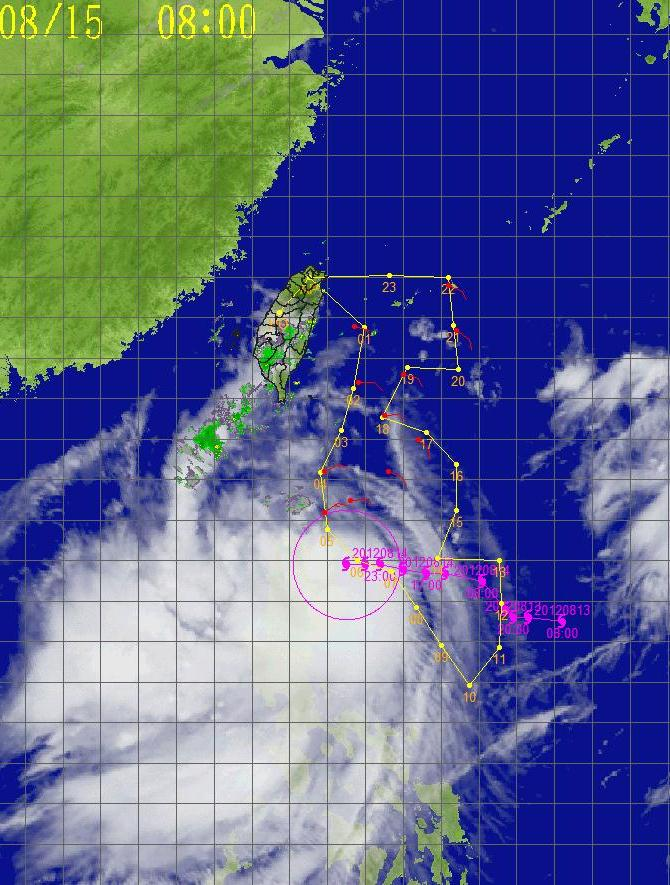
Typhoon Kai-Tak - 2012/08/15 0000 UTC
Flight route of DOTSTAR
Storm symbol in black: Location of the storm center at 2012/08/15 0000 UTC.
Storm symbol in green: Location of the storm center as the first dropwindsonde reached the surface.
Storm symbol in blue: Location of the storm center as the last dropwindsonde reached the surface.
Wind vector at each pressure level
Dropwindsonde information and the estimated surface wind speed
| NO. | TIME | Longitude | Latitude | DIST | WD | WS | MBL | WL150 |
|---|---|---|---|---|---|---|---|---|
| 1 | 2012/08/14 21:53:55 | 122.7 | 23.8 | 678 | 106 | --- | 5.5 | 4.7 |
| 2 | 2012/08/14 22:07:46 | 122.8 | 22.4 | 512 | 076 | 7.0 | 6.4 | 5.2 |
| 3 | 2012/08/14 22:20:10 | 122.6 | 21.1 | 366 | 062 | --- | 9.1 | 8.7 |
| 4 | 2012/08/14 22:31:07 | 121.9 | 20.2 | 265 | 063 | 12.3 | 11.3 | 10.8 |
| 5 | 2012/08/14 22:40:13 | 121.9 | 19.2 | 153 | 045 | 14.2 | 12.7 | 12.4 |
| 6 | 2012/08/14 22:48:36 | 122.6 | 19.5 | 181 | 057 | --- | 11.0 | 9.7 |
| 7 | 2012/08/14 22:59:13 | 123.6 | 20.2 | 295 | 085 | --- | 8.8 | 8.3 |
| 8 | 2012/08/14 23:10:11 | 124.4 | 21.0 | 418 | 109 | 8.7 | 7.4 | 7.4 |
| 9 | 2012/08/14 23:20:11 | 123.5 | 21.5 | 420 | 080 | --- | 8.0 | 7.1 |
| 10 | 2012/08/14 23:32:00 | 124.0 | 22.6 | 549 | 082 | --- | 6.3 | 6.5 |
| 11 | 2012/08/14 23:46:00 | 125.4 | 22.7 | 626 | 091 | 5.1 | 6.9 | 5.5 |
| 12 | 2012/08/14 23:55:29 | 125.4 | 23.7 | 718 | 117 | --- | 6.5 | 6.3 |
| 13 | 2012/08/15 00:06:47 | 125.2 | 24.8 | 817 | 095 | --- | 5.1 | 5.1 |
| 14 | 2012/08/15 00:17:30 | 124.1 | 24.9 | 789 | --- | --- | --- | --- |
TIME: Time when dropwindsondes reached the surface. (UTC)
DIST: The distance form each dropwindsonde to the corresponded storm center. (km)
WD: Surface wind direction. (degree)
Surface wind speed: (unit : m/s)
(1) WS: Surface wind speed (at a height of 10 meters) directly from the dropwindsondes.
(2) MBL (Franklin 2003): Averaging the dropwindsonde wind speed over the 0~500 m layer, multiplied by 0.80.
(3) WL150 (Franklin 2003): Averaging the dropwindsonde wind speed over the 0~150 m layer, divided by 1.229.
CWA QPESUMS Image
(925 hPa wind, one full barb = 10 m/s)
Ask for Data
If you want to ask for the raw data of dropwindsondes, please contact with Central Weather Administration (CWA).