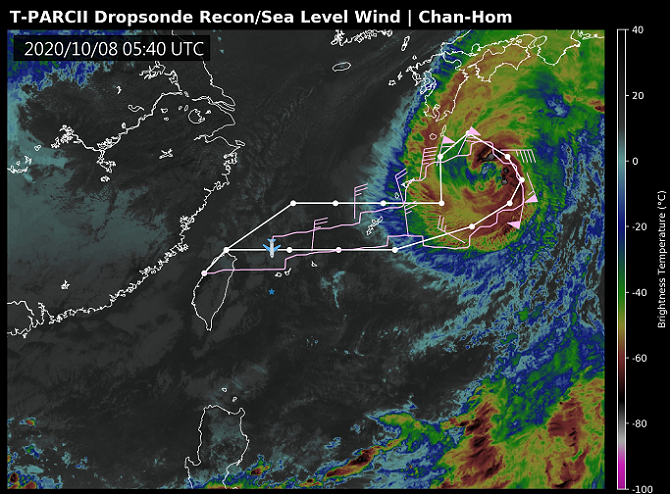
Typhoon Chan-Hom - 2020/10/08 0600 UTC
Flight route of DOTSTAR
Storm symbol in black: Location of the storm center at 2020/10/08 0600 UTC.
Storm symbol in green: Location of the storm center as the first dropwindsonde reached the surface.
Storm symbol in blue: Location of the storm center as the last dropwindsonde reached the surface.
Wind vector at each pressure level
Dropwindsonde information and the estimated surface wind speed
| NO. | TIME | Longitude | Latitude | DIST | WD | WS | MBL | WL150 |
|---|---|---|---|---|---|---|---|---|
| 1 | 2020/10/08 04:12:39 | 125.2 | 25.4 | 824 | 004 | 11.0 | 10.8 | 10.8 |
| 2 | 2020/10/08 04:46:59 | 129.4 | 26.1 | 441 | 359 | 15.2 | 12.0 | 11.6 |
| 3 | 2020/10/08 05:06:05 | 131.8 | 25.8 | 337 | 298 | --- | 11.8 | 10.9 |
| 4 | 2020/10/08 05:30:06 | 134.3 | 27.5 | 207 | 190 | --- | 24.2 | 21.3 |
| 5 | 2020/10/08 05:39:48 | 134.6 | 28.5 | 177 | 159 | 27.5 | 27.7 | --- |
| 6 | 2020/10/08 05:52:00 | 133.7 | 29.6 | 125 | 090 | 24.1 | 24.7 | 22.0 |
| 7 | 2020/10/08 06:08:48 | 131.7 | 29.7 | 148 | 025 | --- | 32.3 | 30.8 |
| 8 | 2020/10/08 06:18:01 | 130.7 | 29.3 | 212 | 017 | --- | 25.4 | 23.8 |
| 9 | 2020/10/08 06:26:11 | 129.9 | 28.6 | 286 | 008 | --- | 18.9 | 19.3 |
| 10 | 2020/10/08 06:38:25 | 129.2 | 27.5 | 385 | 351 | --- | 8.8 | 8.2 |
| 11 | 2020/10/08 06:57:27 | 127.1 | 26.9 | 606 | 004 | 11.0 | 9.9 | 10.1 |
TIME: Time when dropwindsondes reached the surface. (UTC)
DIST: The distance form each dropwindsonde to the corresponded storm center. (km)
WD: Surface wind direction. (degree)
Surface wind speed: (unit : m/s)
(1) WS: Surface wind speed (at a height of 10 meters) directly from the dropwindsondes.
(2) MBL (Franklin 2003): Averaging the dropwindsonde wind speed over the 0~500 m layer, multiplied by 0.80.
(3) WL150 (Franklin 2003): Averaging the dropwindsonde wind speed over the 0~150 m layer, divided by 1.229.
CWA QPESUMS Image
(925 hPa wind, one full barb = 10 m/s)
Ask for Data
If you want to ask for the raw data of dropwindsondes, please contact with Central Weather Administration (CWA).