Typhoon Neoguri - 2019/10/20 0000 UTC
Flight route of DOTSTAR
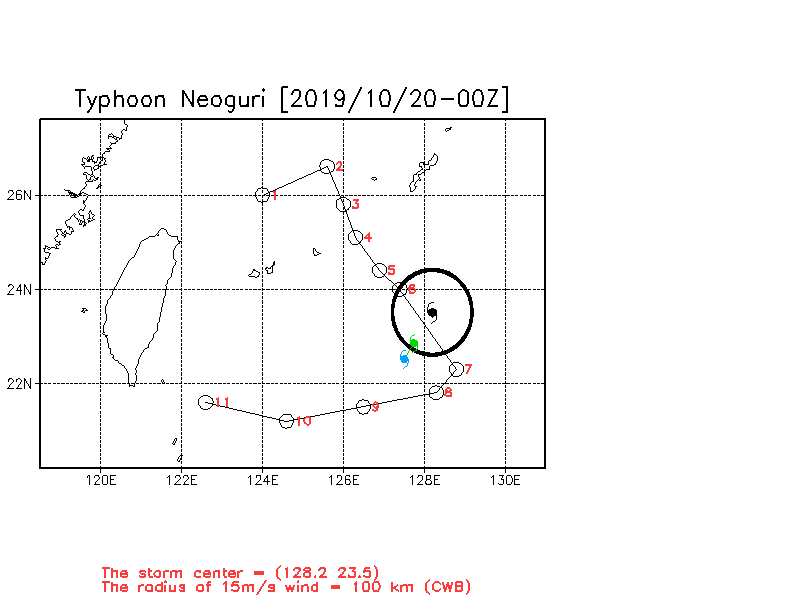
Storm symbol in black: Location of the storm center at 2019/10/20 0000 UTC.
Storm symbol in green: Location of the storm center as the first dropwindsonde reached the surface.
Storm symbol in blue: Location of the storm center as the last dropwindsonde reached the surface.
Wind vector at each pressure level
Dropwindsonde information and the estimated surface wind speed
| NO. | TIME | Longitude | Latitude | DIST | WD | WS | MBL | WL150 |
|---|---|---|---|---|---|---|---|---|
| 1 | 2019/10/20 03:53:32 | 124.0 | 26.0 | 517 | 020 | 13.7 | 11.2 | 11.5 |
| 2 | 2019/10/20 04:06:00 | 125.6 | 26.6 | 473 | 034 | 15.2 | 11.7 | 12.2 |
| 3 | 2019/10/20 04:15:17 | 126.0 | 25.8 | 376 | 038 | 15.5 | 12.5 | 12.9 |
| 4 | 2019/10/20 04:23:32 | 126.3 | 25.1 | 290 | --- | --- | --- | --- |
| 5 | 2019/10/20 04:30:46 | 126.9 | 24.4 | 205 | 011 | --- | 7.0 | 6.8 |
| 6 | 2019/10/20 04:36:37 | 127.4 | 24.0 | 140 | 343 | 8.3 | 8.2 | 7.2 |
| 7 | 2019/10/20 04:56:59 | 128.8 | 22.3 | 128 | 252 | --- | 7.2 | 7.5 |
| 8 | 2019/10/20 05:03:38 | 128.3 | 21.8 | 115 | 265 | --- | 4.6 | 4.7 |
| 9 | 2019/10/20 05:19:14 | 126.5 | 21.5 | 171 | 342 | --- | 4.5 | 4.3 |
| 10 | 2019/10/20 05:34:52 | 124.6 | 21.2 | 336 | 000 | --- | 9.4 | 9.3 |
| 11 | 2019/10/20 05:54:47 | 122.6 | 21.6 | 520 | 012 | --- | 9.7 | 9.8 |
TIME: Time when dropwindsondes reached the surface. (UTC)
DIST: The distance form each dropwindsonde to the corresponded storm center. (km)
WD: Surface wind direction. (degree)
Surface wind speed: (unit : m/s)
(1) WS: Surface wind speed (at a height of 10 meters) directly from the dropwindsondes.
(2) MBL (Franklin 2003): Averaging the dropwindsonde wind speed over the 0~500 m layer, multiplied by 0.80.
(3) WL150 (Franklin 2003): Averaging the dropwindsonde wind speed over the 0~150 m layer, divided by 1.229.
CWA QPESUMS Image
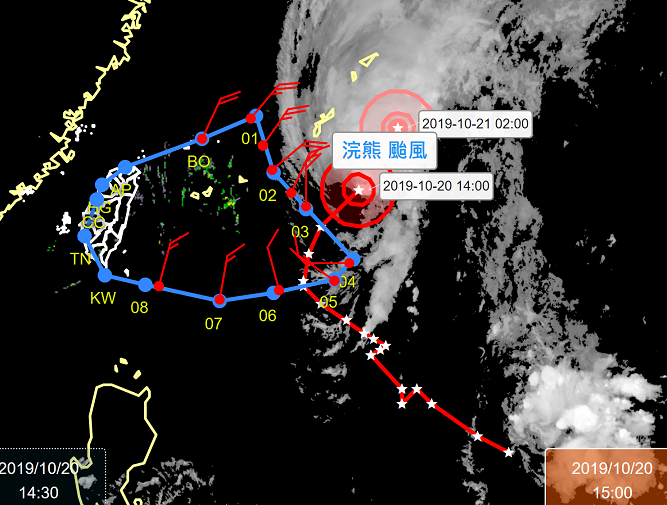
(925 hPa wind, one full barb = 10 m/s)
Ask for Data
If you want to ask for the raw data of dropwindsondes, please contact with Central Weather Administration (CWA).