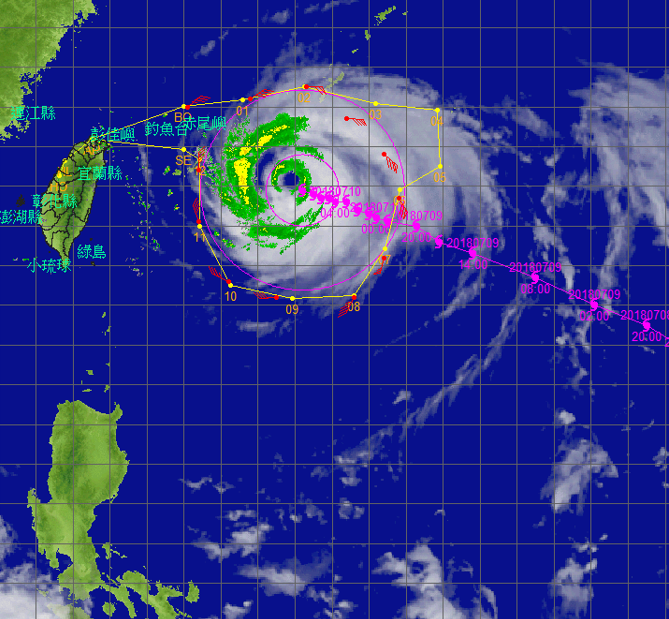
Typhoon Maria - 2018/07/10 0000 UTC
Flight route of DOTSTAR
Storm symbol in black: Location of the storm center at 2018/07/10 0000 UTC.
Storm symbol in green: Location of the storm center as the first dropwindsonde reached the surface.
Storm symbol in blue: Location of the storm center as the last dropwindsonde reached the surface.
Wind vector at each pressure level
Dropwindsonde information and the estimated surface wind speed
| NO. | TIME | Longitude | Latitude | DIST | WD | WS | MBL | WL150 |
|---|---|---|---|---|---|---|---|---|
| 1 | 2018/07/09 21:58:57 | 124.1 | 26.0 | 391 | 022 | 13.6 | 12.8 | 11.4 |
| 2 | 2018/07/09 22:13:07 | 125.8 | 26.2 | 283 | 039 | 18.9 | 15.5 | 14.7 |
| 3 | 2018/07/09 22:25:05 | 127.3 | 26.5 | 267 | 076 | 21.3 | 20.5 | 17.5 |
| 4 | 2018/07/09 22:38:21 | 128.4 | 25.7 | 221 | 080 | 21.9 | 26.1 | 26.0 |
| 5 | 2018/07/09 22:51:17 | 129.4 | 24.8 | 249 | 118 | 26.9 | 27.4 | 26.4 |
| 6 | 2018/07/09 23:00:58 | 129.8 | 23.7 | 292 | 141 | --- | 27.0 | 22.8 |
| 7 | 2018/07/09 23:15:31 | 129.4 | 22.2 | 344 | 166 | --- | 20.0 | 17.0 |
| 8 | 2018/07/09 23:29:14 | 128.6 | 21.2 | 383 | 184 | 12.3 | 16.8 | 13.8 |
| 9 | 2018/07/09 23:45:47 | 126.5 | 21.2 | 336 | 240 | 15.1 | 15.0 | 14.0 |
| 10 | 2018/07/09 23:57:07 | 125.2 | 21.6 | 332 | 283 | --- | 12.8 | 12.8 |
| 11 | 2018/07/10 00:11:29 | 124.4 | 23.1 | 260 | 326 | 15.9 | 15.5 | 13.9 |
| 12 | 2018/07/10 00:21:44 | 124.4 | 24.4 | 216 | 347 | 15.0 | 15.2 | 14.1 |
TIME: Time when dropwindsondes reached the surface. (UTC)
DIST: The distance form each dropwindsonde to the corresponded storm center. (km)
WD: Surface wind direction. (degree)
Surface wind speed: (unit : m/s)
(1) WS: Surface wind speed (at a height of 10 meters) directly from the dropwindsondes.
(2) MBL (Franklin 2003): Averaging the dropwindsonde wind speed over the 0~500 m layer, multiplied by 0.80.
(3) WL150 (Franklin 2003): Averaging the dropwindsonde wind speed over the 0~150 m layer, divided by 1.229.
CWA QPESUMS Image
(925 hPa wind, one full barb = 10 m/s)
Ask for Data
If you want to ask for the raw data of dropwindsondes, please contact with Central Weather Administration (CWA).