Typhoon Mangkhut - 2018/09/15 1200 UTC
Flight route of DOTSTAR
Storm symbol in black: Location of the storm center at 2018/09/15 1200 UTC.
Storm symbol in green: Location of the storm center as the first dropwindsonde reached the surface.
Storm symbol in blue: Location of the storm center as the last dropwindsonde reached the surface.
Wind vector at each pressure level
Dropwindsonde information and the estimated surface wind speed
| NO. | TIME | Longitude | Latitude | DIST | WD | WS | MBL | WL150 |
|---|---|---|---|---|---|---|---|---|
| 1 | 2018/09/15 12:00:13 | 120.8 | 20.7 | 311 | 111 | 28.8 | 26.2 | 24.4 |
| 2 | 2018/09/15 12:12:30 | 120.9 | 19.6 | 283 | 116 | 21.5 | 22.1 | 18.9 |
| 3 | 2018/09/15 12:24:01 | 120.7 | 19.3 | 256 | 125 | --- | 22.3 | 18.7 |
| 4 | 2018/09/15 12:33:46 | 120.4 | 20.4 | 269 | 116 | --- | 29.6 | 24.1 |
| 5 | 2018/09/15 12:42:03 | 119.9 | 21.1 | 277 | --- | --- | 30.8 | --- |
TIME: Time when dropwindsondes reached the surface. (UTC)
DIST: The distance form each dropwindsonde to the corresponded storm center. (km)
WD: Surface wind direction. (degree)
Surface wind speed: (unit : m/s)
(1) WS: Surface wind speed (at a height of 10 meters) directly from the dropwindsondes.
(2) MBL (Franklin 2003): Averaging the dropwindsonde wind speed over the 0~500 m layer, multiplied by 0.80.
(3) WL150 (Franklin 2003): Averaging the dropwindsonde wind speed over the 0~150 m layer, divided by 1.229.
CWA QPESUMS Image
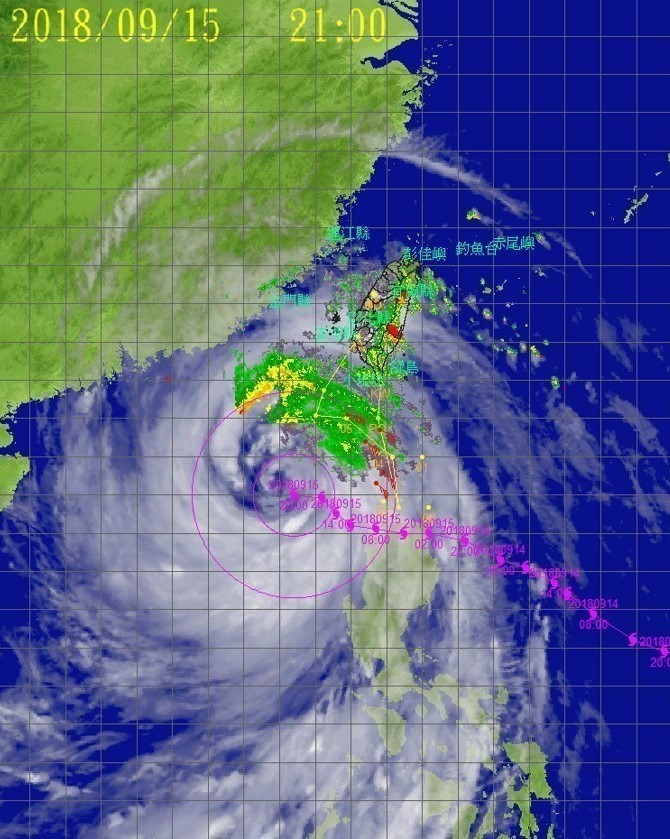
(925 hPa wind, one full barb = 10 m/s)
Ask for Data
If you want to ask for the raw data of dropwindsondes, please contact with Central Weather Administration (CWA).