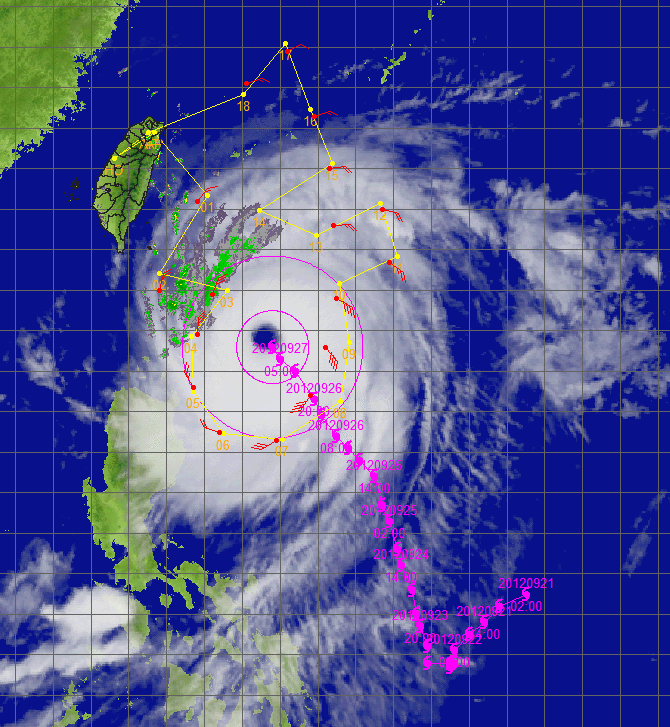
Typhoon Jelawat - 2012/09/27 0000 UTC
Flight route of DOTSTAR
Storm symbol in black: Location of the storm center at 2012/09/27 0000 UTC.
Storm symbol in green: Location of the storm center as the first dropwindsonde reached the surface.
Storm symbol in blue: Location of the storm center as the last dropwindsonde reached the surface.
Wind vector at each pressure level
Dropwindsonde information and the estimated surface wind speed
| NO. | TIME | Longitude | Latitude | DIST | WD | WS | MBL | WL150 |
|---|---|---|---|---|---|---|---|---|
| 1 | 2012/09/26 21:54:11 | 122.8 | 23.2 | 467 | 040 | --- | 13.5 | 12.8 |
| 2 | 2012/09/26 22:20:10 | 121.8 | 21.0 | 359 | 011 | --- | 18.3 | 18.4 |
| 3 | 2012/09/26 22:31:29 | 123.2 | 20.9 | 230 | 014 | 18.1 | 21.5 | 18.6 |
| 4 | 2012/09/26 22:44:09 | 122.8 | 19.9 | 221 | --- | --- | --- | --- |
| 5 | 2012/09/26 22:54:16 | 122.7 | 18.6 | 253 | --- | --- | --- | --- |
| 6 | 2012/09/26 23:07:01 | 123.4 | 17.5 | 275 | --- | --- | 16.4 | --- |
| 7 | 2012/09/26 23:19:34 | 124.9 | 17.3 | 255 | --- | --- | --- | --- |
| 8 | 2012/09/26 23:31:12 | 125.8 | 18.4 | 177 | 207 | --- | 30.8 | 27.2 |
| 9 | 2012/09/26 23:41:05 | 126.2 | 19.6 | 149 | --- | --- | --- | --- |
| 10 | 2012/09/26 23:52:05 | 126.5 | 20.8 | 226 | 104 | 25.8 | 28.6 | 24.6 |
| 11 | 2012/09/27 00:06:06 | 127.9 | 21.7 | 403 | 101 | --- | 16.3 | 15.3 |
| 12 | 2012/09/27 00:18:10 | 127.7 | 23.0 | 477 | 089 | --- | 14.0 | 13.8 |
| 13 | 2012/09/27 00:31:30 | 126.4 | 22.5 | 359 | 072 | 15.3 | 18.5 | 17.0 |
| 14 | 2012/09/27 00:46:17 | 126.3 | 24.0 | 502 | 072 | --- | 14.3 | 13.8 |
| 15 | 2012/09/27 00:57:44 | 125.9 | 25.3 | 627 | 049 | --- | 12.7 | 12.6 |
| 16 | 2012/09/27 01:11:47 | 125.2 | 26.9 | 791 | 065 | --- | 10.1 | 10.0 |
| 17 | 2012/09/27 01:25:06 | 124.1 | 26.1 | 703 | 064 | --- | 11.8 | 11.9 |
TIME: Time when dropwindsondes reached the surface. (UTC)
DIST: The distance form each dropwindsonde to the corresponded storm center. (km)
WD: Surface wind direction. (degree)
Surface wind speed: (unit : m/s)
(1) WS: Surface wind speed (at a height of 10 meters) directly from the dropwindsondes.
(2) MBL (Franklin 2003): Averaging the dropwindsonde wind speed over the 0~500 m layer, multiplied by 0.80.
(3) WL150 (Franklin 2003): Averaging the dropwindsonde wind speed over the 0~150 m layer, divided by 1.229.
CWA QPESUMS Image
(925 hPa wind, one full barb = 10 m/s)
Ask for Data
If you want to ask for the raw data of dropwindsondes, please contact with Central Weather Administration (CWA).