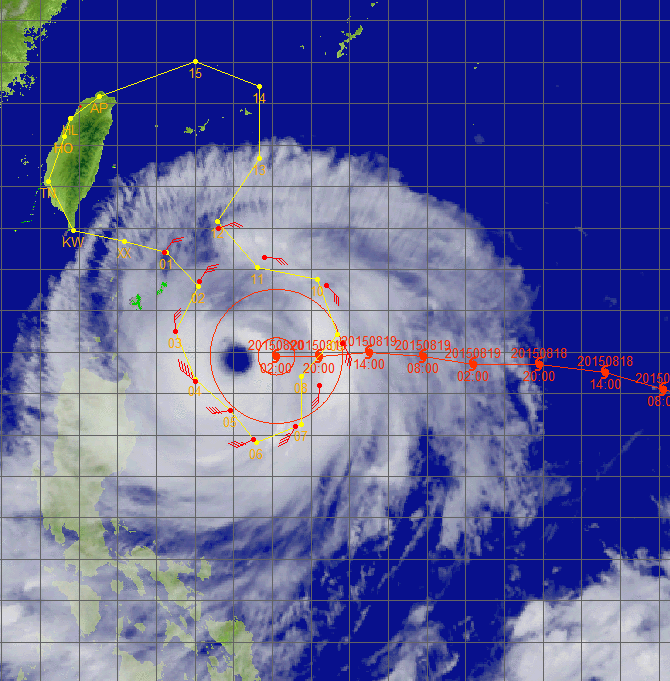
Typhoon Goni - 2015/08/20 0000 UTC
Flight route of DOTSTAR
Storm symbol in black: Location of the storm center at 2015/08/20 0000 UTC.
Storm symbol in green: Location of the storm center as the first dropwindsonde reached the surface.
Storm symbol in blue: Location of the storm center as the last dropwindsonde reached the surface.
Wind vector at each pressure level
Dropwindsonde information and the estimated surface wind speed
| NO. | TIME | Longitude | Latitude | DIST | WD | WS | MBL | WL150 |
|---|---|---|---|---|---|---|---|---|
| 1 | 2015/08/19 21:55:53 | 123.2 | 21.4 | 393 | 016 | --- | 15.3 | 14.6 |
| 2 | 2015/08/19 22:06:07 | 124.1 | 20.6 | 270 | 004 | 25.0 | 22.8 | 22.2 |
| 3 | 2015/08/19 22:15:50 | 123.5 | 19.5 | 228 | 339 | 21.8 | 22.5 | 20.7 |
| 4 | 2015/08/19 22:27:29 | 124.0 | 18.3 | 155 | 294 | 26.5 | 30.5 | 26.3 |
| 5 | 2015/08/19 22:36:35 | 124.9 | 17.6 | 122 | 251 | --- | 24.9 | 22.9 |
| 6 | 2015/08/19 22:42:41 | 125.5 | 16.9 | 183 | 233 | 23.4 | 23.4 | 20.4 |
| 7 | 2015/08/19 22:52:43 | 126.6 | 17.2 | 200 | 192 | 14.2 | 21.3 | 15.7 |
| 8 | 2015/08/19 23:01:46 | 127.2 | 18.2 | 203 | 182 | --- | 23.0 | 20.1 |
| 9 | 2015/08/19 23:10:48 | 127.8 | 19.2 | 265 | 138 | --- | 22.2 | 17.0 |
| 10 | 2015/08/19 23:23:10 | 127.4 | 20.6 | 317 | 137 | 17.2 | 18.9 | 16.6 |
| 11 | 2015/08/19 23:37:17 | 125.8 | 21.3 | 314 | 075 | 16.5 | 19.3 | 17.4 |
| 12 | 2015/08/19 23:48:12 | 124.6 | 22.0 | 397 | 044 | 19.1 | 17.4 | 16.1 |
TIME: Time when dropwindsondes reached the surface. (UTC)
DIST: The distance form each dropwindsonde to the corresponded storm center. (km)
WD: Surface wind direction. (degree)
Surface wind speed: (unit : m/s)
(1) WS: Surface wind speed (at a height of 10 meters) directly from the dropwindsondes.
(2) MBL (Franklin 2003): Averaging the dropwindsonde wind speed over the 0~500 m layer, multiplied by 0.80.
(3) WL150 (Franklin 2003): Averaging the dropwindsonde wind speed over the 0~150 m layer, divided by 1.229.
CWA QPESUMS Image
(925 hPa wind, one full barb = 10 m/s)
Ask for Data
If you want to ask for the raw data of dropwindsondes, please contact with Central Weather Administration (CWA).