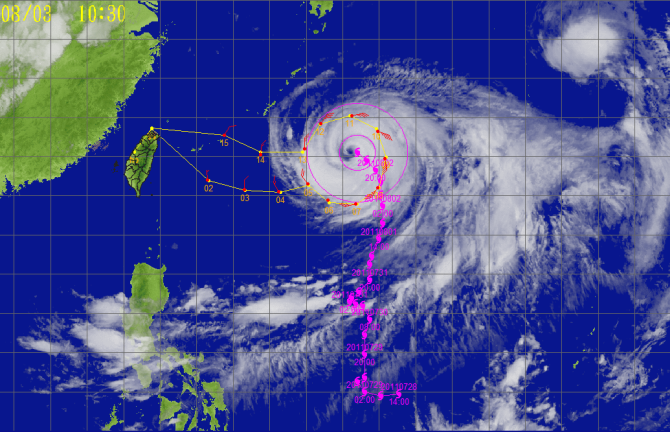
Typhoon Muifa - 2011/08/03 0000 UTC
Flight route of DOTSTAR
Storm symbol in black: Location of the storm center at 2011/08/03 0000 UTC.
Storm symbol in green: Location of the storm center as the first dropwindsonde reached the surface.
Storm symbol in blue: Location of the storm center as the last dropwindsonde reached the surface.
Wind vector at each pressure level
Dropwindsonde information and the estimated surface wind speed
| NO. | TIME | Longitude | Latitude | DIST | WD | WS | MBL | WL150 |
|---|---|---|---|---|---|---|---|---|
| 1 | 2011/08/02 22:07:15 | 124.6 | 22.8 | 843 | 354 | --- | 6.0 | 6.0 |
| 2 | 2011/08/02 22:25:17 | 126.6 | 22.3 | 659 | 330 | --- | 6.3 | 5.4 |
| 3 | 2011/08/02 22:37:22 | 128.5 | 22.2 | 481 | 320 | 11.1 | 9.9 | 9.1 |
| 4 | 2011/08/02 22:54:56 | 130.1 | 22.6 | 322 | 309 | 15.6 | 15.6 | 13.9 |
| 5 | 2011/08/02 23:07:06 | 131.2 | 21.8 | 302 | --- | --- | --- | --- |
| 6 | 2011/08/02 23:19:00 | 132.7 | 21.6 | 284 | --- | --- | 19.6 | --- |
| 7 | 2011/08/02 23:31:05 | 133.9 | 22.4 | 239 | 203 | --- | 23.4 | 18.8 |
| 8 | 2011/08/02 23:44:42 | 134.3 | 23.9 | 174 | 144 | --- | 28.8 | 24.2 |
| 9 | 2011/08/02 23:57:43 | 133.9 | 25.3 | 178 | 094 | --- | 30.2 | 25.4 |
| 10 | 2011/08/03 00:05:27 | 132.5 | 26.0 | 205 | 056 | --- | 25.0 | 22.5 |
| 11 | 2011/08/03 00:19:30 | 130.8 | 25.7 | 243 | 023 | --- | 19.9 | 18.6 |
| 12 | 2011/08/03 00:37:33 | 129.9 | 24.4 | 275 | 347 | --- | 18.3 | 17.3 |
| 13 | 2011/08/03 00:52:27 | 127.5 | 24.1 | 518 | 351 | --- | 9.3 | 8.7 |
| 14 | 2011/08/03 01:15:38 | 125.5 | 25.0 | 723 | 055 | --- | 6.6 | 6.2 |
TIME: Time when dropwindsondes reached the surface. (UTC)
DIST: The distance form each dropwindsonde to the corresponded storm center. (km)
WD: Surface wind direction. (degree)
Surface wind speed: (unit : m/s)
(1) WS: Surface wind speed (at a height of 10 meters) directly from the dropwindsondes.
(2) MBL (Franklin 2003): Averaging the dropwindsonde wind speed over the 0~500 m layer, multiplied by 0.80.
(3) WL150 (Franklin 2003): Averaging the dropwindsonde wind speed over the 0~150 m layer, divided by 1.229.
CWA QPESUMS Image
(925 hPa wind, one full barb = 10 m/s)
Ask for Data
If you want to ask for the raw data of dropwindsondes, please contact with Central Weather Administration (CWA).