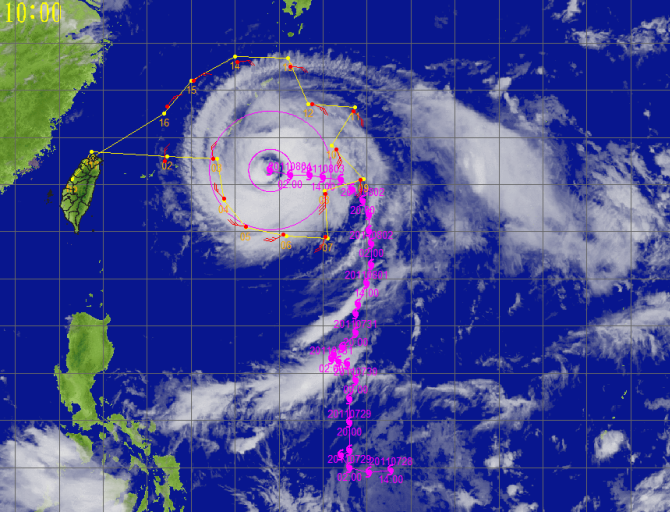
Typhoon Muifa - 2011/08/04 0000 UTC
Flight route of DOTSTAR
Storm symbol in black: Location of the storm center at 2011/08/04 0000 UTC.
Storm symbol in green: Location of the storm center as the first dropwindsonde reached the surface.
Storm symbol in blue: Location of the storm center as the last dropwindsonde reached the surface.
Wind vector at each pressure level
Dropwindsonde information and the estimated surface wind speed
| NO. | TIME | Longitude | Latitude | DIST | WD | WS | MBL | WL150 |
|---|---|---|---|---|---|---|---|---|
| 1 | 2011/08/03 22:00:57 | 124.8 | 25.0 | 514 | 249 | 73.0 | 13.4 | 14.9 |
| 2 | 2011/08/03 22:19:22 | 127.0 | 25.1 | 294 | 350 | --- | 16.9 | 15.5 |
| 3 | 2011/08/03 22:35:08 | 127.5 | 23.4 | 269 | 303 | 17.2 | 18.2 | 17.4 |
| 4 | 2011/08/03 22:42:58 | 128.4 | 22.2 | 295 | 266 | 12.7 | 17.7 | 13.6 |
| 5 | 2011/08/03 23:02:14 | 130.2 | 21.9 | 306 | 231 | --- | 18.9 | 17.0 |
| 6 | 2011/08/03 23:18:02 | 132.1 | 21.8 | 400 | 190 | --- | 16.6 | 15.1 |
| 7 | 2011/08/03 23:36:53 | 132.1 | 23.6 | 269 | --- | --- | 22.2 | 20.6 |
| 8 | 2011/08/03 23:49:36 | 133.7 | 24.2 | 417 | 139 | --- | 19.5 | 15.9 |
| 9 | 2011/08/04 00:01:03 | 132.6 | 25.5 | 316 | 135 | --- | 21.4 | 19.1 |
| 10 | 2011/08/04 00:20:29 | 133.4 | 27.1 | 471 | 116 | --- | 14.6 | 12.8 |
| 11 | 2011/08/04 00:38:43 | 131.5 | 27.4 | 370 | 091 | 21.3 | 20.0 | 18.2 |
| 12 | 2011/08/04 00:55:19 | 130.5 | 29.0 | 496 | 092 | --- | 15.4 | 14.6 |
| 13 | 2011/08/04 01:12:46 | 128.1 | 29.2 | 529 | 072 | 16.1 | 13.1 | 12.9 |
| 14 | 2011/08/04 01:28:55 | 126.1 | 28.4 | 537 | 048 | --- | 12.6 | 12.5 |
| 15 | 2011/08/04 01:46:55 | 124.9 | 27.3 | 535 | 018 | --- | 11.2 | 9.1 |
TIME: Time when dropwindsondes reached the surface. (UTC)
DIST: The distance form each dropwindsonde to the corresponded storm center. (km)
WD: Surface wind direction. (degree)
Surface wind speed: (unit : m/s)
(1) WS: Surface wind speed (at a height of 10 meters) directly from the dropwindsondes.
(2) MBL (Franklin 2003): Averaging the dropwindsonde wind speed over the 0~500 m layer, multiplied by 0.80.
(3) WL150 (Franklin 2003): Averaging the dropwindsonde wind speed over the 0~150 m layer, divided by 1.229.
CWA QPESUMS Image
(925 hPa wind, one full barb = 10 m/s)
Ask for Data
If you want to ask for the raw data of dropwindsondes, please contact with Central Weather Administration (CWA).