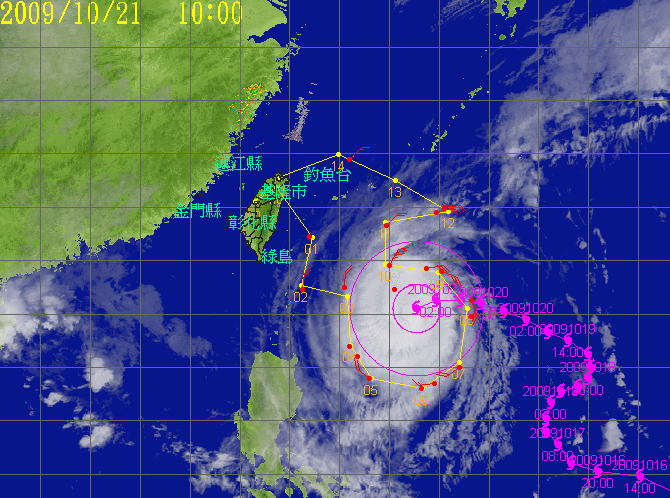
Typhoon Lupit - 2009/10/21 0000 UTC
Flight route of DOTSTAR
Storm symbol in black: Location of the storm center at 2009/10/21 0000 UTC.
Storm symbol in green: Location of the storm center as the first dropwindsonde reached the surface.
Storm symbol in blue: Location of the storm center as the last dropwindsonde reached the surface.
Wind vector at each pressure level
Dropwindsonde information and the estimated surface wind speed
| NO. | TIME | Longitude | Latitude | DIST | WD | WS | MBL | WL150 |
|---|---|---|---|---|---|---|---|---|
| 1 | 2009/10/20 21:20:06 | 122.8 | 22.9 | 558 | --- | --- | --- | --- |
| 2 | 2009/10/20 21:51:08 | 122.5 | 20.9 | 516 | 008 | 16.7 | 13.9 | 14.0 |
| 3 | 2009/10/20 22:06:27 | 124.2 | 21.0 | 340 | 351 | --- | 15.9 | 15.3 |
| 4 | 2009/10/20 22:17:24 | 124.4 | 18.8 | 345 | --- | --- | --- | --- |
| 5 | 2009/10/20 22:21:26 | 124.7 | 18.4 | 347 | 310 | --- | 15.2 | 13.8 |
| 6 | 2009/10/20 22:36:16 | 125.2 | 17.6 | 367 | 308 | 15.2 | 13.0 | 12.5 |
| 7 | 2009/10/20 22:54:07 | 127.3 | 17.2 | 337 | --- | --- | --- | --- |
| 8 | 2009/10/20 22:59:21 | 127.8 | 17.4 | 322 | 243 | --- | 13.4 | 12.5 |
| 9 | 2009/10/20 23:09:43 | 128.8 | 18.0 | 298 | 238 | 12.0 | 12.7 | 11.2 |
| 10 | 2009/10/20 23:27:25 | 129.3 | 19.9 | 227 | --- | --- | --- | --- |
| 11 | 2009/10/20 23:32:10 | 129.3 | 20.5 | 223 | 150 | --- | 19.2 | 16.2 |
| 12 | 2009/10/20 23:45:59 | 128.1 | 21.6 | 186 | 085 | --- | 20.2 | 18.7 |
| 13 | 2009/10/20 23:50:48 | 127.5 | 21.7 | 172 | 059 | --- | 21.2 | --- |
| 14 | 2009/10/21 00:03:00 | 125.9 | 21.8 | 218 | 018 | --- | 24.4 | 23.2 |
| 15 | 2009/10/21 00:16:49 | 125.8 | 23.3 | 367 | --- | --- | --- | --- |
| 16 | 2009/10/21 00:29:02 | 127.9 | 23.8 | 408 | 057 | --- | 15.8 | 14.1 |
| 17 | 2009/10/21 00:40:06 | 128.2 | 24.0 | 443 | 052 | --- | 13.9 | 12.8 |
| 18 | 2009/10/21 00:56:50 | 126.1 | 24.9 | 537 | --- | --- | --- | --- |
| 19 | 2009/10/21 01:16:36 | 124.4 | 25.8 | 687 | 051 | 12.9 | 12.3 | 12.2 |
TIME: Time when dropwindsondes reached the surface. (UTC)
DIST: The distance form each dropwindsonde to the corresponded storm center. (km)
WD: Surface wind direction. (degree)
Surface wind speed: (unit : m/s)
(1) WS: Surface wind speed (at a height of 10 meters) directly from the dropwindsondes.
(2) MBL (Franklin 2003): Averaging the dropwindsonde wind speed over the 0~500 m layer, multiplied by 0.80.
(3) WL150 (Franklin 2003): Averaging the dropwindsonde wind speed over the 0~150 m layer, divided by 1.229.
CWA QPESUMS Image
(925 hPa wind, one full barb = 10 m/s)
Ask for Data
If you want to ask for the raw data of dropwindsondes, please contact with Central Weather Administration (CWA).