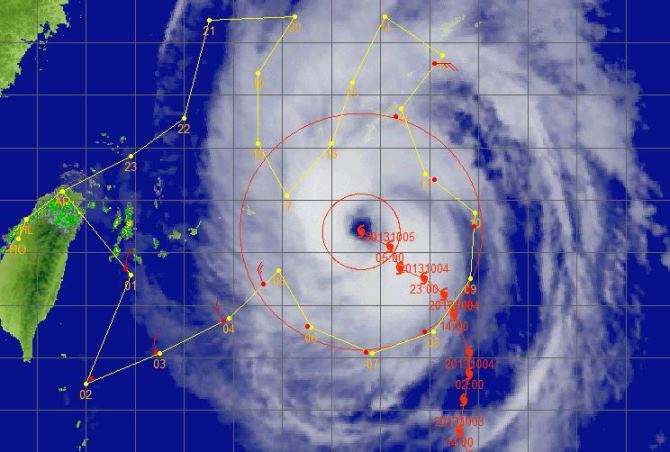
Typhoon Fitow - 2013/10/05 1200 UTC
Flight route of DOTSTAR
Storm symbol in black: Location of the storm center at 2013/10/05 1200 UTC.
Storm symbol in green: Location of the storm center as the first dropwindsonde reached the surface.
Storm symbol in blue: Location of the storm center as the last dropwindsonde reached the surface.
Wind vector at each pressure level
Dropwindsonde information and the estimated surface wind speed
| NO. | TIME | Longitude | Latitude | DIST | WD | WS | MBL | WL150 |
|---|---|---|---|---|---|---|---|---|
| 1 | 2013/10/04 21:48:50 | 122.8 | 23.7 | 356 | 000 | 16.3 | 15.7 | 14.4 |
| 2 | 2013/10/04 22:10:04 | 122.1 | 21.6 | 559 | 003 | 12.3 | 10.2 | 9.7 |
| 3 | 2013/10/04 22:25:19 | 123.4 | 22.0 | 431 | 340 | 10.3 | 12.8 | 12.6 |
| 4 | 2013/10/04 22:37:48 | 124.8 | 22.7 | 295 | 324 | 14.9 | 13.1 | 13.0 |
| 5 | 2013/10/04 22:46:23 | 125.6 | 23.4 | 199 | 313 | --- | 19.0 | 17.2 |
| 6 | 2013/10/04 22:57:32 | 126.5 | 22.6 | 278 | 291 | --- | 19.8 | 18.0 |
| 7 | 2013/10/04 23:06:40 | 127.7 | 22.1 | 370 | 244 | 15.6 | 17.7 | 15.4 |
| 8 | 2013/10/04 23:17:43 | 128.9 | 22.5 | 417 | 202 | 18.5 | 19.1 | 16.6 |
| 9 | 2013/10/04 23:28:26 | 129.8 | 23.3 | 433 | 155 | --- | 21.2 | 19.8 |
| 10 | 2013/10/04 23:38:54 | 129.9 | 24.5 | 398 | 132 | --- | 21.0 | 19.0 |
| 11 | 2013/10/04 23:49:14 | 129.1 | 25.4 | 310 | 100 | --- | 24.8 | 22.1 |
| 12 | 2013/10/05 00:01:13 | 128.3 | 26.6 | 286 | 065 | --- | 19.9 | 18.5 |
| 13 | 2013/10/05 00:13:05 | 129.1 | 27.6 | 418 | 069 | 9.4 | 17.3 | 14.3 |
| 14 | 2013/10/05 00:23:00 | 128.3 | 28.4 | 429 | 049 | --- | 18.1 | 17.1 |
| 15 | 2013/10/05 00:35:50 | 127.5 | 27.4 | 292 | 057 | --- | 19.1 | 16.9 |
| 16 | 2013/10/05 00:47:25 | 127.0 | 26.2 | 162 | --- | --- | --- | --- |
| 17 | 2013/10/05 00:58:20 | 125.7 | 26.1 | 114 | 044 | --- | 19.2 | 16.8 |
| 18 | 2013/10/05 01:08:35 | 125.6 | 27.1 | 226 | 033 | 17.0 | 17.7 | 15.9 |
| 19 | 2013/10/05 01:19:39 | 126.1 | 28.3 | 351 | 057 | 14.0 | 13.7 | 12.1 |
| 20 | 2013/10/05 01:33:27 | 124.8 | 28.4 | 388 | 034 | --- | 15.4 | 14.4 |
| 21 | 2013/10/05 01:52:12 | 124.0 | 26.8 | 273 | 025 | --- | 17.4 | 14.9 |
| 22 | 2013/10/05 01:55:07 | 123.3 | 26.1 | 291 | 007 | --- | 15.6 | 13.6 |
TIME: Time when dropwindsondes reached the surface. (UTC)
DIST: The distance form each dropwindsonde to the corresponded storm center. (km)
WD: Surface wind direction. (degree)
Surface wind speed: (unit : m/s)
(1) WS: Surface wind speed (at a height of 10 meters) directly from the dropwindsondes.
(2) MBL (Franklin 2003): Averaging the dropwindsonde wind speed over the 0~500 m layer, multiplied by 0.80.
(3) WL150 (Franklin 2003): Averaging the dropwindsonde wind speed over the 0~150 m layer, divided by 1.229.
CWA QPESUMS Image
(925 hPa wind, one full barb = 10 m/s)
Ask for Data
If you want to ask for the raw data of dropwindsondes, please contact with Central Weather Administration (CWA).