Typhoon Fanapi - 2010/09/17 0000 UTC
Flight route of DOTSTAR
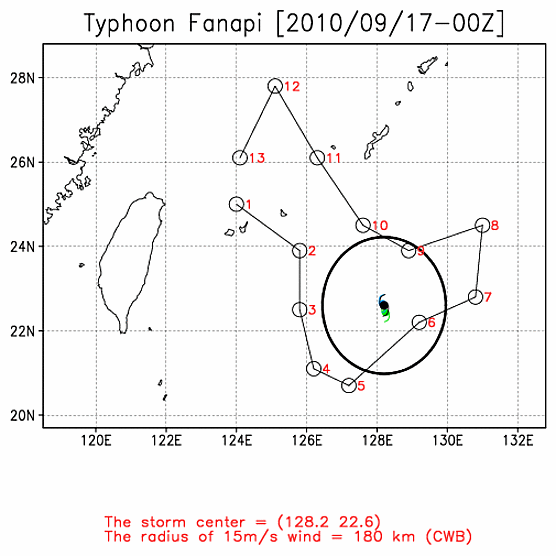
Storm symbol in black: Location of the storm center at 2010/09/17 0000 UTC.
Storm symbol in green: Location of the storm center as the first dropwindsonde reached the surface.
Storm symbol in blue: Location of the storm center as the last dropwindsonde reached the surface.
Wind vector at each pressure level
Dropwindsonde information and the estimated surface wind speed
| NO. | TIME | Longitude | Latitude | DIST | WD | WS | MBL | WL150 |
|---|---|---|---|---|---|---|---|---|
| 1 | 2010/09/16 21:26:07 | 124.0 | 25.0 | 518 | 010 | --- | 6.9 | 7.1 |
| 2 | 2010/09/16 21:45:20 | 125.8 | 23.9 | 299 | 040 | 12.6 | 10.0 | 10.9 |
| 3 | 2010/09/16 21:53:09 | 125.8 | 22.5 | 253 | 356 | --- | 13.1 | 12.8 |
| 4 | 2010/09/16 22:13:24 | 126.2 | 21.1 | 259 | 296 | --- | 11.4 | 11.8 |
| 5 | 2010/09/16 22:23:51 | 127.2 | 20.7 | 222 | 264 | --- | 15.9 | --- |
| 6 | 2010/09/16 22:48:02 | 129.2 | 22.2 | 107 | 139 | --- | 33.0 | 31.4 |
| 7 | 2010/09/16 23:02:32 | 130.8 | 22.8 | 271 | 134 | --- | 14.5 | 11.4 |
| 8 | 2010/09/16 23:19:06 | 131.0 | 24.5 | 353 | 120 | 11.8 | 11.3 | 11.3 |
| 9 | 2010/09/16 23:37:57 | 128.9 | 23.9 | 160 | 103 | 20.1 | 20.6 | 18.1 |
| 10 | 2010/09/16 23:50:40 | 127.6 | 24.5 | 216 | 066 | 14.0 | 12.8 | 12.7 |
| 11 | 2010/09/17 00:11:23 | 126.3 | 26.1 | 432 | 061 | --- | 7.1 | 7.0 |
| 12 | 2010/09/17 00:30:37 | 125.1 | 27.8 | 650 | 056 | --- | 7.0 | 7.5 |
| 13 | 2010/09/17 00:49:39 | 124.1 | 26.1 | 568 | 028 | --- | 7.2 | 7.0 |
TIME: Time when dropwindsondes reached the surface. (UTC)
DIST: The distance form each dropwindsonde to the corresponded storm center. (km)
WD: Surface wind direction. (degree)
Surface wind speed: (unit : m/s)
(1) WS: Surface wind speed (at a height of 10 meters) directly from the dropwindsondes.
(2) MBL (Franklin 2003): Averaging the dropwindsonde wind speed over the 0~500 m layer, multiplied by 0.80.
(3) WL150 (Franklin 2003): Averaging the dropwindsonde wind speed over the 0~150 m layer, divided by 1.229.
CWA QPESUMS Image
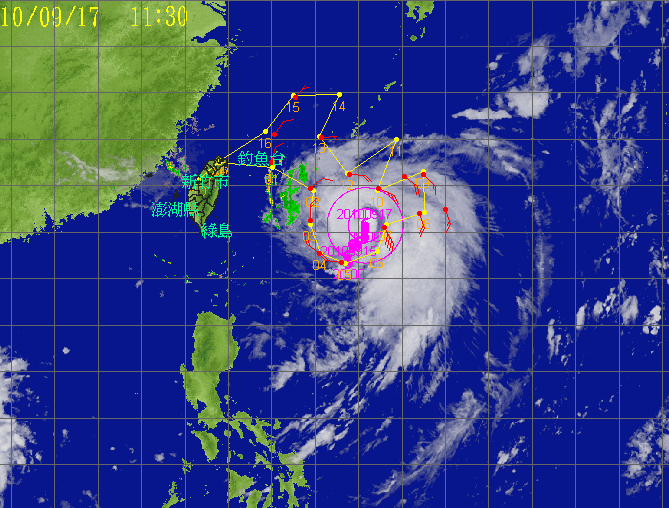
(925 hPa wind, one full barb = 10 m/s)
Flight paths of the ITOP joint observations - 2010/09/17 0000 UTC
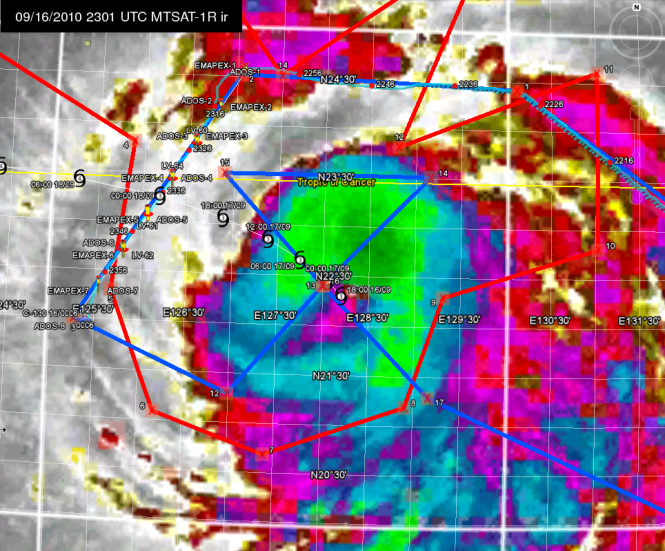
(DOTSTAR(red line),C-130(blue line))
Ask for Data
If you want to ask for the raw data of dropwindsondes, please contact with Central Weather Administration (CWA).