Typhoon Lionrock - 2010/09/01 0000 UTC
Flight route of DOTSTAR
Storm symbol in black: Location of the storm center at 2010/09/01 0000 UTC.
Storm symbol in green: Location of the storm center as the first dropwindsonde reached the surface.
Storm symbol in blue: Location of the storm center as the last dropwindsonde reached the surface.
Wind vector at each pressure level
Dropwindsonde information and the estimated surface wind speed
| NO. | TIME | Longitude | Latitude | DIST | WD | WS | MBL | WL150 |
|---|---|---|---|---|---|---|---|---|
| 1 | 2010/08/31 21:57:14 | 119.3 | 23.9 | 208 | 047 | --- | 4.4 | 6.5 |
| 2 | 2010/08/31 22:05:53 | 118.8 | 23.5 | 169 | 027 | 5.7 | 5.2 | 5.0 |
| 3 | 2010/08/31 22:14:31 | 118.2 | 23.0 | 159 | 358 | 8.9 | 6.7 | 7.0 |
| 4 | 2010/08/31 22:18:09 | 117.5 | 22.3 | 203 | 273 | 5.9 | 6.2 | 6.6 |
| 5 | 2010/08/31 22:29:47 | 116.9 | 21.9 | 266 | 261 | --- | 10.1 | 8.9 |
| 6 | 2010/08/31 22:39:14 | 116.4 | 20.8 | 349 | 241 | 10.5 | 11.7 | 10.0 |
| 7 | 2010/08/31 22:50:55 | 116.6 | 19.7 | 404 | 225 | 8.0 | 7.1 | 7.2 |
| 8 | 2010/08/31 22:59:46 | 117.4 | 19.1 | 404 | 260 | 9.7 | 8.3 | 8.3 |
| 9 | 2010/08/31 23:10:24 | 118.5 | 18.9 | 381 | 223 | 11.4 | 10.3 | 10.2 |
| 10 | 2010/08/31 22:59:46 | 119.4 | 19.3 | 320 | --- | --- | --- | --- |
| 11 | 2010/08/31 23:26:25 | 119.9 | 20.4 | 208 | --- | --- | --- | --- |
| 12 | 2010/08/31 23:38:35 | 120.7 | 21.5 | 151 | 201 | 14.8 | 15.7 | 14.6 |
| 13 | 2010/08/31 23:55:00 | 121.8 | 21.9 | 241 | 163 | 11.8 | 12.2 | 12.2 |
| 14 | 2010/09/01 00:05:28 | 122.5 | 22.8 | 313 | 149 | 11.1 | 12.3 | 10.9 |
| 15 | 2010/09/01 00:17:57 | 122.8 | 24.1 | 392 | 146 | --- | 11.7 | 11.4 |
| 16 | 2010/09/01 00:22:56 | 122.7 | 25.2 | 458 | 163 | --- | 13.3 | 14.1 |
TIME: Time when dropwindsondes reached the surface. (UTC)
DIST: The distance form each dropwindsonde to the corresponded storm center. (km)
WD: Surface wind direction. (degree)
Surface wind speed: (unit : m/s)
(1) WS: Surface wind speed (at a height of 10 meters) directly from the dropwindsondes.
(2) MBL (Franklin 2003): Averaging the dropwindsonde wind speed over the 0~500 m layer, multiplied by 0.80.
(3) WL150 (Franklin 2003): Averaging the dropwindsonde wind speed over the 0~150 m layer, divided by 1.229.
CWA QPESUMS Image
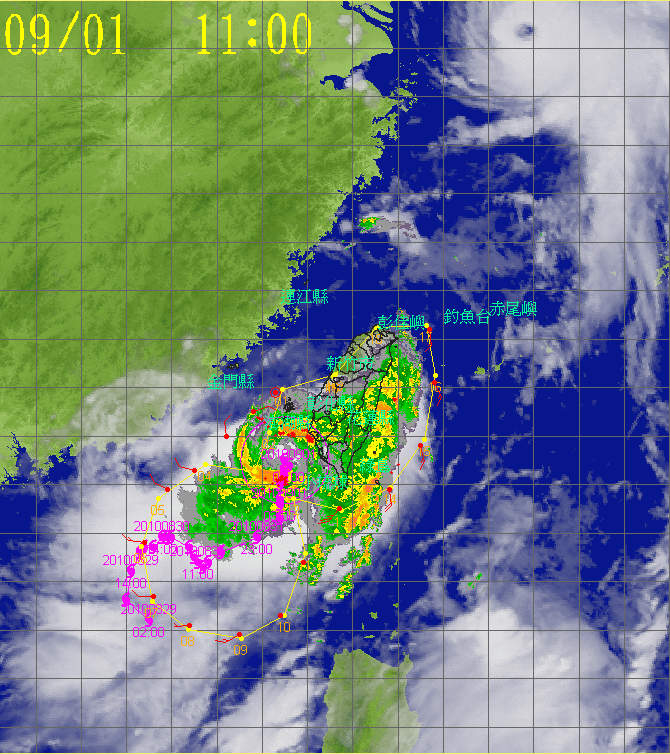
(925 hPa wind, one full barb = 10 m/s)
Ask for Data
If you want to ask for the raw data of dropwindsondes, please contact with Central Weather Administration (CWA).