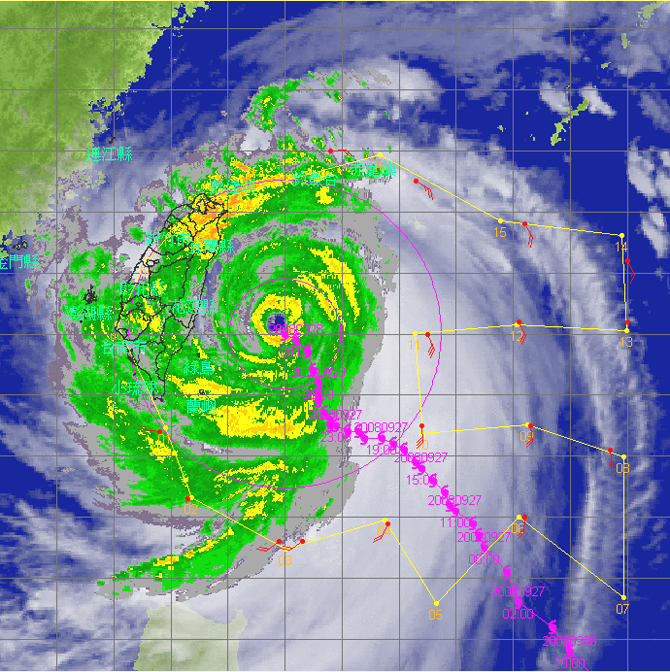
Typhoon Jangmi - 2008/09/28 0000 UTC
Flight route of DOTSTAR
Storm symbol in black: Location of the storm center at 2008/09/28 0000 UTC.
Storm symbol in green: Location of the storm center as the first dropwindsonde reached the surface.
Storm symbol in blue: Location of the storm center as the last dropwindsonde reached the surface.
Wind vector at each pressure level
Dropwindsonde information and the estimated surface wind speed
| NO. | TIME | Longitude | Latitude | DIST | WD | WS | MBL | WL150 |
|---|---|---|---|---|---|---|---|---|
| 1 | 2008/09/27 21:28:17 | 120.8 | 21.4 | 301 | --- | --- | 11.3 | --- |
| 2 | 2008/09/27 21:39:41 | 121.3 | 20.3 | 323 | --- | --- | --- | --- |
| 3 | 2008/09/27 21:54:23 | 122.9 | 19.6 | 315 | 213 | --- | 15.0 | 13.6 |
| 4 | 2008/09/27 21:57:45 | 123.3 | 19.6 | 311 | 214 | --- | 14.4 | 12.5 |
| 5 | 2008/09/27 22:10:48 | 124.8 | 19.9 | 315 | 186 | --- | 13.1 | 11.4 |
| 6 | 2008/09/27 22:30:18 | 127.2 | 20.0 | 481 | 164 | --- | 13.3 | 10.4 |
| 7 | 2008/09/27 22:49:15 | 128.7 | 21.1 | 571 | 161 | 12.6 | 12.2 | 11.3 |
| 8 | 2008/09/27 23:04:29 | 127.3 | 21.5 | 425 | 158 | --- | 14.5 | 13.4 |
| 9 | 2008/09/27 23:21:05 | 125.4 | 21.5 | 256 | 160 | --- | 21.2 | 19.8 |
| 10 | 2008/09/27 23:35:29 | 125.5 | 23.0 | 228 | --- | --- | 23.6 | --- |
| 11 | 2008/09/27 23:48:39 | 127.1 | 23.2 | 397 | 147 | 16.9 | 15.4 | 15.3 |
| 12 | 2008/09/27 23:51:51 | 129.0 | 23.2 | 591 | --- | --- | --- | --- |
| 13 | 2008/09/28 00:12:50 | 129.0 | 24.2 | 612 | 138 | --- | 12.0 | 11.5 |
| 14 | 2008/09/28 00:31:06 | 127.2 | 24.8 | 465 | 127 | 15.5 | 13.9 | 13.4 |
| 15 | 2008/09/28 00:48:34 | 125.3 | 25.5 | 362 | 096 | --- | 16.3 | 15.9 |
| 16 | 2008/09/28 01:00:21 | 123.8 | 26.0 | 343 | 062 | --- | 16.3 | 13.9 |
TIME: Time when dropwindsondes reached the surface. (UTC)
DIST: The distance form each dropwindsonde to the corresponded storm center. (km)
WD: Surface wind direction. (degree)
Surface wind speed: (unit : m/s)
(1) WS: Surface wind speed (at a height of 10 meters) directly from the dropwindsondes.
(2) MBL (Franklin 2003): Averaging the dropwindsonde wind speed over the 0~500 m layer, multiplied by 0.80.
(3) WL150 (Franklin 2003): Averaging the dropwindsonde wind speed over the 0~150 m layer, divided by 1.229.
CWA QPESUMS Image
(925 hPa wind, one full barb = 10 m/s)
Ask for Data
If you want to ask for the raw data of dropwindsondes, please contact with Central Weather Administration (CWA).