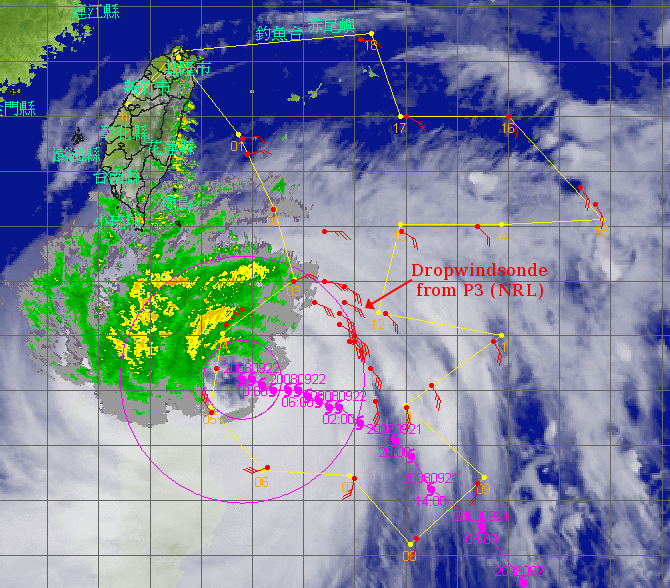
Typhoon Hagupit - 2008/09/22 0000 UTC
Flight route of DOTSTAR
Storm symbol in black: Location of the storm center at 2008/09/22 0000 UTC.
Storm symbol in green: Location of the storm center as the first dropwindsonde reached the surface.
Storm symbol in blue: Location of the storm center as the last dropwindsonde reached the surface.
Wind vector at each pressure level
Dropwindsonde information and the estimated surface wind speed
| NO. | TIME | Longitude | Latitude | DIST | WD | WS | MBL | WL150 |
|---|---|---|---|---|---|---|---|---|
| 1 | 2008/09/21 21:43:48 | 122.8 | 23.6 | 531 | 048 | 10.6 | 9.0 | 8.2 |
| 2 | 2008/09/21 21:47:24 | 122.9 | 23.3 | 495 | 053 | 11.8 | 12.0 | 11.0 |
| 3 | 2008/09/21 21:58:13 | 123.4 | 22.3 | 371 | --- | --- | --- | --- |
| 4 | 2008/09/21 22:10:49 | 123.8 | 21.0 | 225 | 048 | --- | 19.9 | 16.4 |
| 5 | 2008/09/21 22:23:18 | 122.5 | 20.2 | 193 | 020 | --- | 24.9 | 22.9 |
| 6 | 2008/09/21 22:30:19 | 122.3 | 19.4 | 164 | --- | --- | --- | --- |
| 7 | 2008/09/21 22:37:10 | 122.2 | 18.6 | 168 | 302 | --- | 21.7 | 12.7 |
| 8 | 2008/09/21 22:49:47 | 123.3 | 17.6 | 166 | 230 | --- | 23.1 | 22.5 |
| 9 | 2008/09/21 23:03:50 | 125.0 | 17.4 | 227 | 179 | 17.4 | 18.9 | 17.3 |
| 10 | 2008/09/21 23:17:58 | 126.2 | 16.3 | 409 | 193 | 18.4 | 15.7 | 14.9 |
| 11 | 2008/09/21 23:30:30 | 127.4 | 17.3 | 445 | 200 | 11.2 | 11.7 | 10.4 |
| 12 | 2008/09/21 23:48:27 | 126.0 | 18.7 | 273 | --- | --- | 15.8 | --- |
| 13 | 2008/09/21 23:54:21 | 126.5 | 19.1 | 319 | 146 | --- | 18.4 | 17.1 |
| 14 | 2008/09/22 00:06:46 | 127.7 | 19.9 | 463 | 127 | --- | 15.6 | 14.5 |
| 15 | 2008/09/22 00:27:12 | 125.6 | 20.4 | 286 | 123 | 20.7 | 19.3 | 18.9 |
| 16 | 2008/09/22 00:42:05 | 125.9 | 21.9 | 419 | 104 | --- | 15.8 | 14.2 |
| 17 | 2008/09/22 00:55:18 | 127.4 | 22.0 | 548 | 124 | 12.4 | 12.4 | 11.4 |
| 18 | 2008/09/22 01:15:25 | 129.7 | 22.4 | 772 | 124 | --- | 11.5 | 9.8 |
| 19 | 2008/09/22 01:19:10 | 129.4 | 22.7 | 761 | 137 | --- | 13.8 | 11.2 |
| 20 | 2008/09/22 01:36:04 | 128.0 | 24.0 | 740 | 102 | --- | 11.1 | 9.0 |
| 21 | 2008/09/22 01:53:09 | 126.0 | 24.0 | 614 | --- | --- | 13.3 | --- |
| 22 | 2008/09/22 02:08:44 | 125.1 | 25.4 | 726 | 090 | --- | 9.5 | 8.8 |
TIME: Time when dropwindsondes reached the surface. (UTC)
DIST: The distance form each dropwindsonde to the corresponded storm center. (km)
WD: Surface wind direction. (degree)
Surface wind speed: (unit : m/s)
(1) WS: Surface wind speed (at a height of 10 meters) directly from the dropwindsondes.
(2) MBL (Franklin 2003): Averaging the dropwindsonde wind speed over the 0~500 m layer, multiplied by 0.80.
(3) WL150 (Franklin 2003): Averaging the dropwindsonde wind speed over the 0~150 m layer, divided by 1.229.
CWA QPESUMS Image
(925 hPa wind, one full barb = 10 m/s)
Ask for Data
If you want to ask for the raw data of dropwindsondes, please contact with Central Weather Administration (CWA).