Typhoon Kalmaegi - 2008/07/16 1200 UTC
Flight route of DOTSTAR
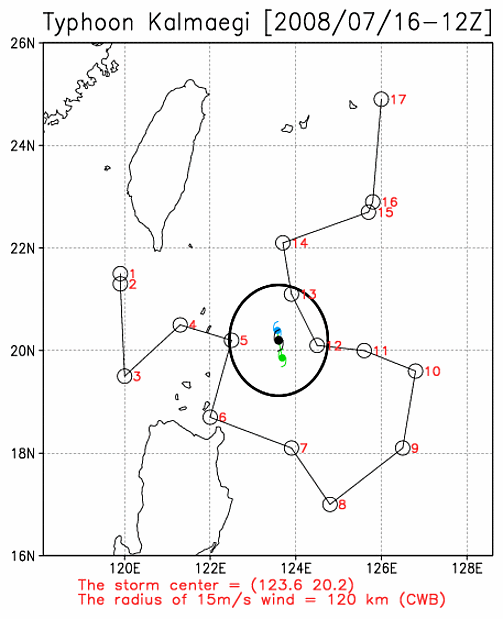
Storm symbol in black: Location of the storm center at 2008/07/16 1200 UTC.
Storm symbol in green: Location of the storm center as the first dropwindsonde reached the surface.
Storm symbol in blue: Location of the storm center as the last dropwindsonde reached the surface.
Wind vector at each pressure level
Dropwindsonde information and the estimated surface wind speed
| NO. | TIME | Longitude | Latitude | DIST | WD | WS | MBL | WL150 |
|---|---|---|---|---|---|---|---|---|
| 1 | 2008/07/16 09:25:33 | 119.9 | 21.5 | 434 | 312 | --- | 6.2 | 6.1 |
| 2 | 2008/07/16 09:18:53 | 119.9 | 21.3 | 426 | 336 | --- | 5.7 | 6.0 |
| 3 | 2008/07/16 09:41:10 | 120.0 | 19.5 | 387 | 293 | --- | 9.1 | 8.9 |
| 4 | 2008/07/16 09:57:15 | 121.3 | 20.5 | 255 | 306 | --- | 11.8 | 10.8 |
| 5 | 2008/07/16 10:09:26 | 122.5 | 20.2 | 124 | 325 | --- | 13.8 | 13.3 |
| 6 | 2008/07/16 10:29:17 | 122.0 | 18.7 | 225 | --- | --- | 13.2 | --- |
| 7 | 2008/07/16 10:49:05 | 123.9 | 18.1 | 218 | 216 | --- | 13.8 | 11.5 |
| 8 | 2008/07/16 11:01:18 | 124.8 | 17.0 | 363 | 215 | 16.8 | 13.4 | 13.3 |
| 9 | 2008/07/16 11:23:01 | 126.5 | 18.1 | 376 | 175 | --- | 12.9 | 12.7 |
| 10 | 2008/07/16 11:38:33 | 126.8 | 19.6 | 339 | 176 | --- | 16.0 | 14.5 |
| 11 | 2008/07/16 11:51:40 | 125.6 | 20.0 | 209 | 202 | --- | 17.1 | 16.1 |
| 12 | 2008/07/16 12:01:06 | 124.5 | 20.1 | 95 | 200 | --- | 22.2 | 19.6 |
| 13 | 2008/07/16 12:10:16 | 123.9 | 21.1 | 101 | 108 | --- | 13.7 | 12.5 |
| 14 | 2008/07/16 12:19:18 | 123.7 | 22.1 | 204 | 087 | --- | 11.2 | 11.3 |
| 15 | 2008/07/16 12:37:15 | 125.7 | 22.7 | 343 | 143 | --- | 12.2 | 12.0 |
| 16 | 2008/07/16 12:36:57 | 125.8 | 22.9 | 367 | 146 | --- | 12.8 | 11.6 |
| 17 | 2008/07/16 12:57:14 | 126.0 | 24.9 | 560 | 155 | --- | 9.6 | 9.9 |
TIME: Time when dropwindsondes reached the surface. (UTC)
DIST: The distance form each dropwindsonde to the corresponded storm center. (km)
WD: Surface wind direction. (degree)
Surface wind speed: (unit : m/s)
(1) WS: Surface wind speed (at a height of 10 meters) directly from the dropwindsondes.
(2) MBL (Franklin 2003): Averaging the dropwindsonde wind speed over the 0~500 m layer, multiplied by 0.80.
(3) WL150 (Franklin 2003): Averaging the dropwindsonde wind speed over the 0~150 m layer, divided by 1.229.
Ask for Data
If you want to ask for the raw data of dropwindsondes, please contact with Central Weather Administration (CWA).