Typhoon Fung-Wong - 2014/09/19 0000 UTC
Flight route of DOTSTAR
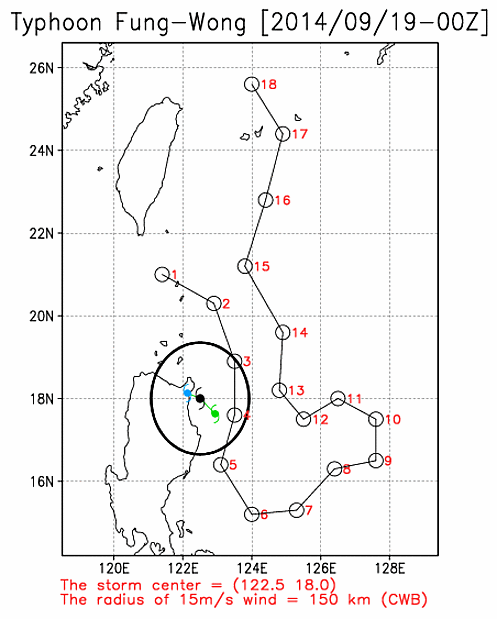
Storm symbol in black: Location of the storm center at 2014/09/19 0000 UTC.
Storm symbol in green: Location of the storm center as the first dropwindsonde reached the surface.
Storm symbol in blue: Location of the storm center as the last dropwindsonde reached the surface.
Wind vector at each pressure level
Dropwindsonde information and the estimated surface wind speed
| NO. | TIME | Longitude | Latitude | DIST | WD | WS | MBL | WL150 |
|---|---|---|---|---|---|---|---|---|
| 1 | 2014/09/18 21:58:55 | 121.4 | 21.0 | 409 | 037 | 13.6 | 13.8 | 12.7 |
| 2 | 2014/09/18 22:13:57 | 122.9 | 20.3 | 292 | 084 | --- | 16.9 | --- |
| 3 | 2014/09/18 22:21:44 | 123.5 | 18.9 | 147 | --- | --- | --- | --- |
| 4 | 2014/09/18 22:36:29 | 123.5 | 17.6 | 76 | 163 | --- | 30.5 | 29.6 |
| 5 | 2014/09/18 22:48:42 | 123.1 | 16.4 | 164 | --- | --- | --- | --- |
| 6 | 2014/09/18 23:02:30 | 124.0 | 15.2 | 325 | 194 | 21.2 | 17.4 | 16.7 |
| 7 | 2014/09/18 23:15:28 | 125.3 | 15.3 | 405 | 185 | 12.8 | 16.3 | 13.1 |
| 8 | 2014/09/18 23:28:58 | 126.4 | 16.3 | 444 | 163 | 14.7 | 15.3 | 13.7 |
| 9 | 2014/09/18 23:39:54 | 127.6 | 16.5 | 555 | 165 | 14.9 | 15.0 | 13.9 |
| 10 | 2014/09/18 23:48:42 | 127.6 | 17.5 | 536 | 178 | 11.9 | 14.0 | 12.4 |
| 11 | 2014/09/19 00:00:57 | 126.5 | 18.0 | 421 | 158 | 15.1 | 14.4 | 12.8 |
| 12 | 2014/09/19 00:11:46 | 125.5 | 17.5 | 330 | 158 | 16.1 | 16.8 | 14.1 |
| 13 | 2014/09/19 00:20:35 | 124.8 | 18.2 | 255 | 142 | 15.3 | 16.8 | 14.9 |
| 14 | 2014/09/19 00:33:40 | 124.9 | 19.6 | 321 | 138 | 19.4 | 16.0 | 15.8 |
| 15 | 2014/09/19 00:49:18 | 123.8 | 21.2 | 381 | 106 | --- | 12.8 | 12.0 |
| 16 | 2014/09/19 01:06:01 | 124.4 | 22.8 | 573 | 119 | --- | 7.0 | 6.7 |
| 17 | 2014/09/19 01:19:48 | 124.9 | 24.4 | 750 | 111 | --- | 6.6 | 6.6 |
| 18 | 2014/09/19 01:34:36 | 124.0 | 25.6 | 857 | 120 | --- | 6.9 | 6.8 |
TIME: Time when dropwindsondes reached the surface. (UTC)
DIST: The distance form each dropwindsonde to the corresponded storm center. (km)
WD: Surface wind direction. (degree)
Surface wind speed: (unit : m/s)
(1) WS: Surface wind speed (at a height of 10 meters) directly from the dropwindsondes.
(2) MBL (Franklin 2003): Averaging the dropwindsonde wind speed over the 0~500 m layer, multiplied by 0.80.
(3) WL150 (Franklin 2003): Averaging the dropwindsonde wind speed over the 0~150 m layer, divided by 1.229.
CWA QPESUMS Image
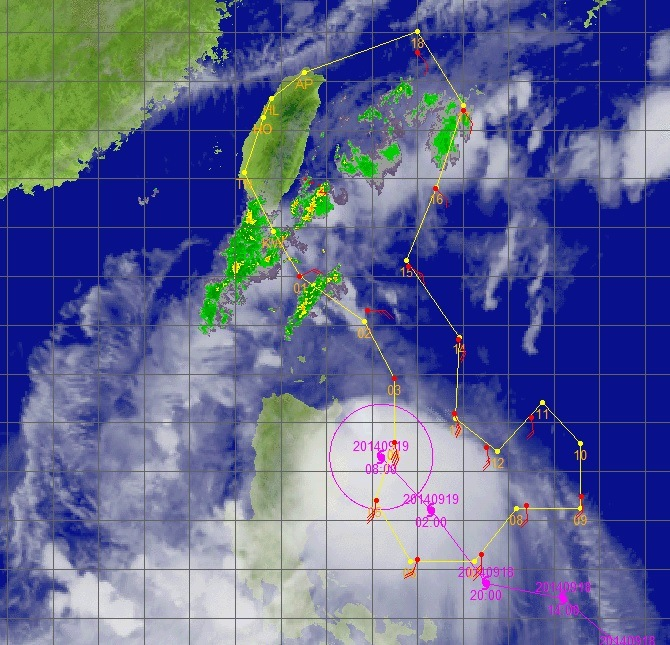
(925 hPa wind, one full barb = 10 m/s)
Ask for Data
If you want to ask for the raw data of dropwindsondes, please contact with Central Weather Administration (CWA).