Typhoon Shanshan - 2006/09/14 0000 UTC
Flight route of DOTSTAR
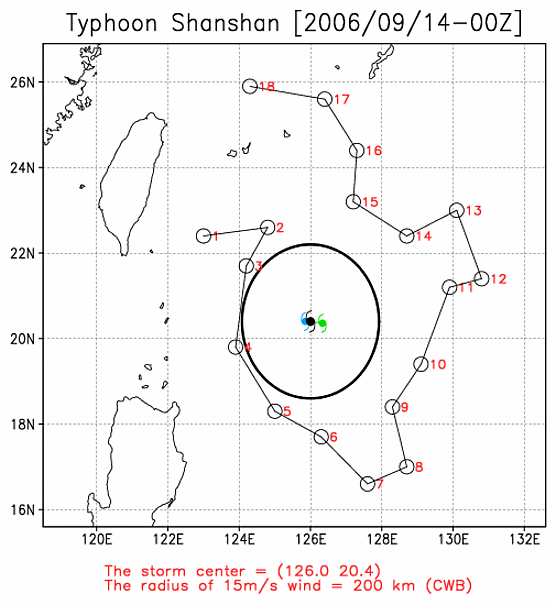
Storm symbol in black: Location of the storm center at 2006/09/14 0000 UTC.
Storm symbol in green: Location of the storm center as the first dropwindsonde reached the surface.
Storm symbol in blue: Location of the storm center as the last dropwindsonde reached the surface.
Wind vector at each pressure level
Dropwindsonde information and the estimated surface wind speed
| NO. | TIME | Longitude | Latitude | DIST | WD | WS | MBL | WL150 |
|---|---|---|---|---|---|---|---|---|
| 1 | 2006/09/13 21:28:55 | 123.0 | 22.4 | 413 | 010 | --- | 10.3 | 9.4 |
| 2 | 2006/09/13 21:47:59 | 124.8 | 22.6 | 293 | 040 | --- | 12.3 | 11.8 |
| 3 | 2006/09/13 22:00:29 | 124.2 | 21.7 | 260 | 016 | --- | 10.8 | 10.8 |
| 4 | 2006/09/13 22:19:28 | 123.9 | 19.8 | 251 | 316 | --- | 14.4 | 13.1 |
| 5 | 2006/09/13 22:37:07 | 125.0 | 18.3 | 262 | 270 | --- | 14.5 | 14.4 |
| 6 | 2006/09/13 22:48:59 | 126.3 | 17.7 | 298 | --- | --- | --- | --- |
| 7 | 2006/09/13 23:08:07 | 127.6 | 16.6 | 449 | 229 | --- | 9.2 | 8.4 |
| 8 | 2006/09/13 23:18:35 | 128.7 | 17.0 | 466 | 208 | --- | 9.2 | 9.4 |
| 9 | 2006/09/13 23:36:01 | 128.3 | 18.4 | 323 | 191 | --- | 13.4 | 12.1 |
| 10 | 2006/09/13 23:47:21 | 129.1 | 19.4 | 340 | --- | --- | --- | --- |
| 11 | 2006/09/14 00:08:12 | 129.9 | 21.2 | 416 | 137 | 11.1 | 11.9 | 10.0 |
| 12 | 2006/09/14 00:16:31 | 130.8 | 21.4 | 513 | 141 | --- | 9.2 | 9.1 |
| 13 | 2006/09/14 00:33:46 | 130.1 | 23.0 | 517 | 154 | --- | 7.9 | 8.9 |
| 14 | 2006/09/14 00:47:55 | 128.7 | 22.4 | 362 | 148 | 14.5 | 14.7 | 13.1 |
| 15 | 2006/09/14 01:03:28 | 127.2 | 23.2 | 338 | 106 | 17.4 | 13.2 | 13.8 |
| 16 | 2006/09/14 01:09:37 | 127.3 | 24.4 | 467 | --- | --- | --- | --- |
| 17 | 2006/09/14 01:28:42 | 126.4 | 25.6 | 580 | 124 | --- | 5.3 | 4.5 |
| 18 | 2006/09/14 01:47:37 | 124.3 | 25.9 | 631 | 042 | 4.6 | 2.0 | 1.2 |
TIME: Time when dropwindsondes reached the surface. (UTC)
DIST: The distance form each dropwindsonde to the corresponded storm center. (km)
WD: Surface wind direction. (degree)
Surface wind speed: (unit : m/s)
(1) WS: Surface wind speed (at a height of 10 meters) directly from the dropwindsondes.
(2) MBL (Franklin 2003): Averaging the dropwindsonde wind speed over the 0~500 m layer, multiplied by 0.80.
(3) WL150 (Franklin 2003): Averaging the dropwindsonde wind speed over the 0~150 m layer, divided by 1.229.
Ask for Data
If you want to ask for the raw data of dropwindsondes, please contact with Central Weather Administration (CWA).